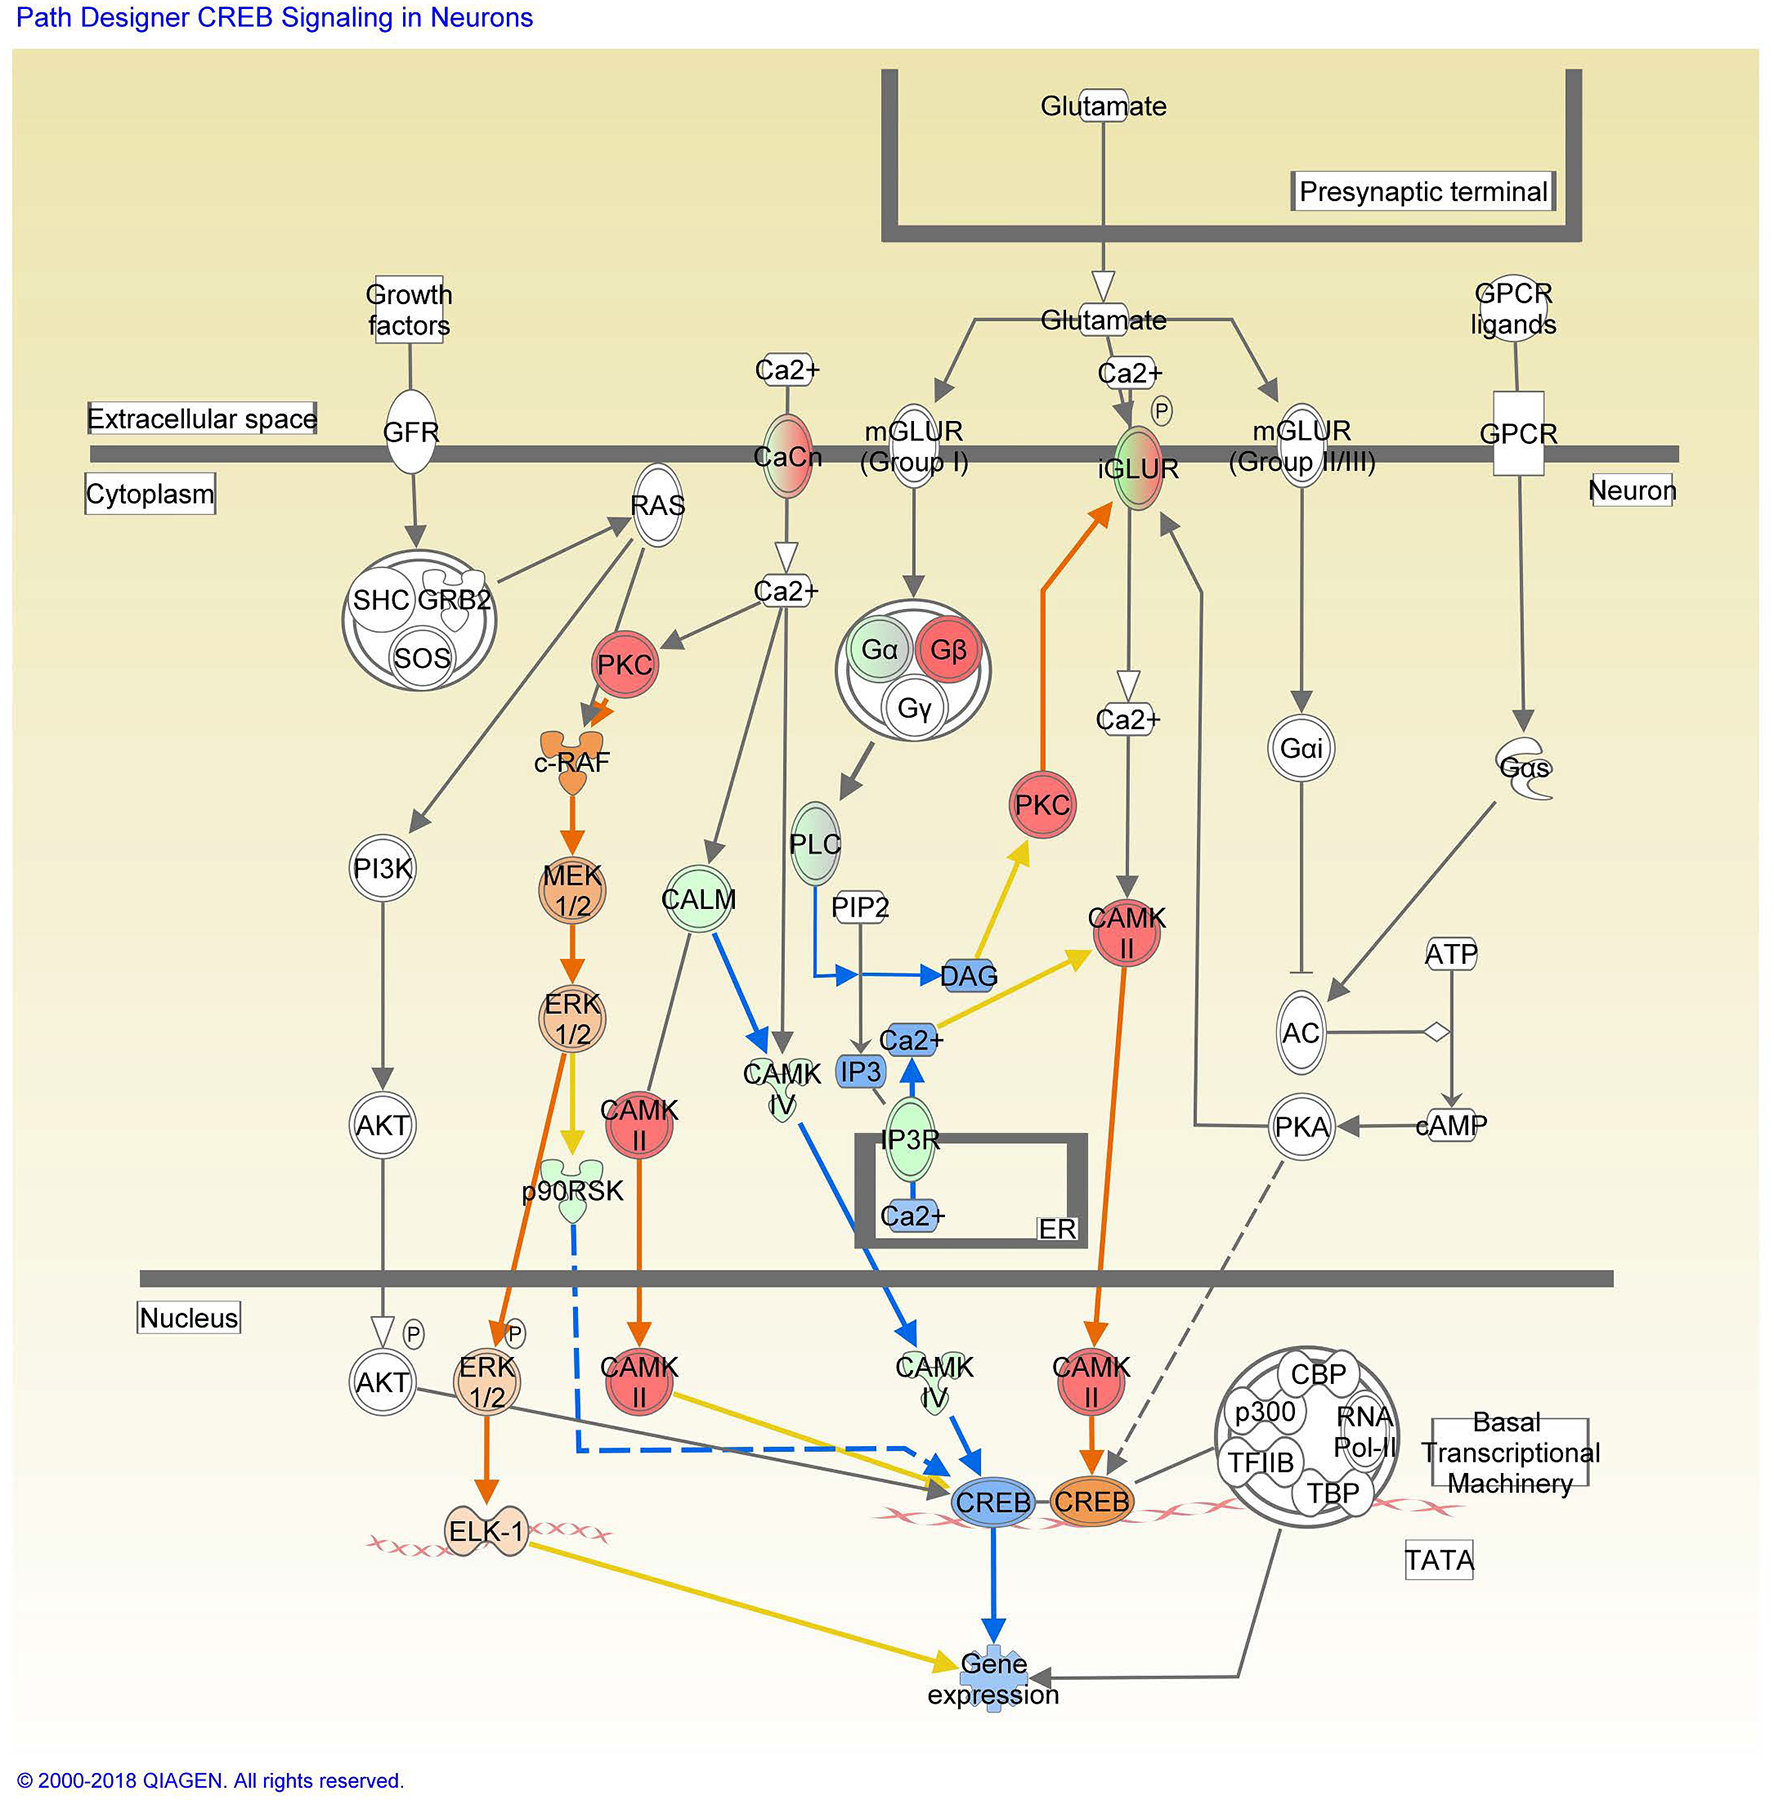
Figure 8. CREB signaling in neurons in response to granisetron treatment with the IPA molecule activity predictor.

Red and green symbols indicate proteins up- and down-regulation in granisetron treated mice, respectively. Orange and blue nodes indicate predictions of to be activated or inhibited in granisetron treated mice, respectively. The color intensity is proportional to the degree of fold change. Edges between the nodes are colored orange when leading to the activation of downstream proteins, blue when inhibiting downstream proteins. Yellow edges indicate that the states of downstream genes are inconsistent with the prediction based on previous findings.
