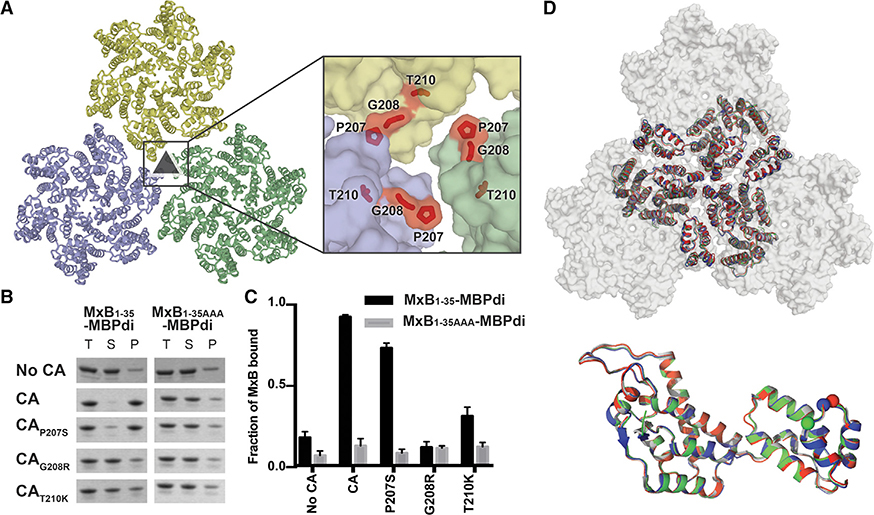
Figure 3. CA Mutations that Escape MxB Restriction Severely Reduce MxB1–35-MBPdi Binding.
(A) P207, G208, and T210 (red sticks) are located at the interface between three CA hexamers (light blue, light green, and light yellow surface).
(B) MxB1–35-MBPdi binding to CA tubes and CA tubes containing the mutations P207S, G208R in co-pelleting assays. The total, soluble, and pellet fractions were analyzed by SDS-PAGE. For simplicity, only the MxB1–35-MBPdi band is shown. Full gels and positive and negative controls performed with MBP-CCCyp and MBP, respectively, are shown in Figure S4.
(C) Quantification of data in (B), performed as in Figure 1. Error bars represent the standard error of the mean from three independent experiments. Quantification of the positive and negative controls can be found in Figure S4.
(D) Alignment of P207S (red), G208R (blue), and T210K (green) crystal structures to the structure of WTCA (white, PDB: 4XFX) at the tri-hexamer interface (top) and within a monomer (bottom). All of the mutations preserve the wild-type lattice structure, with only minor differences.

