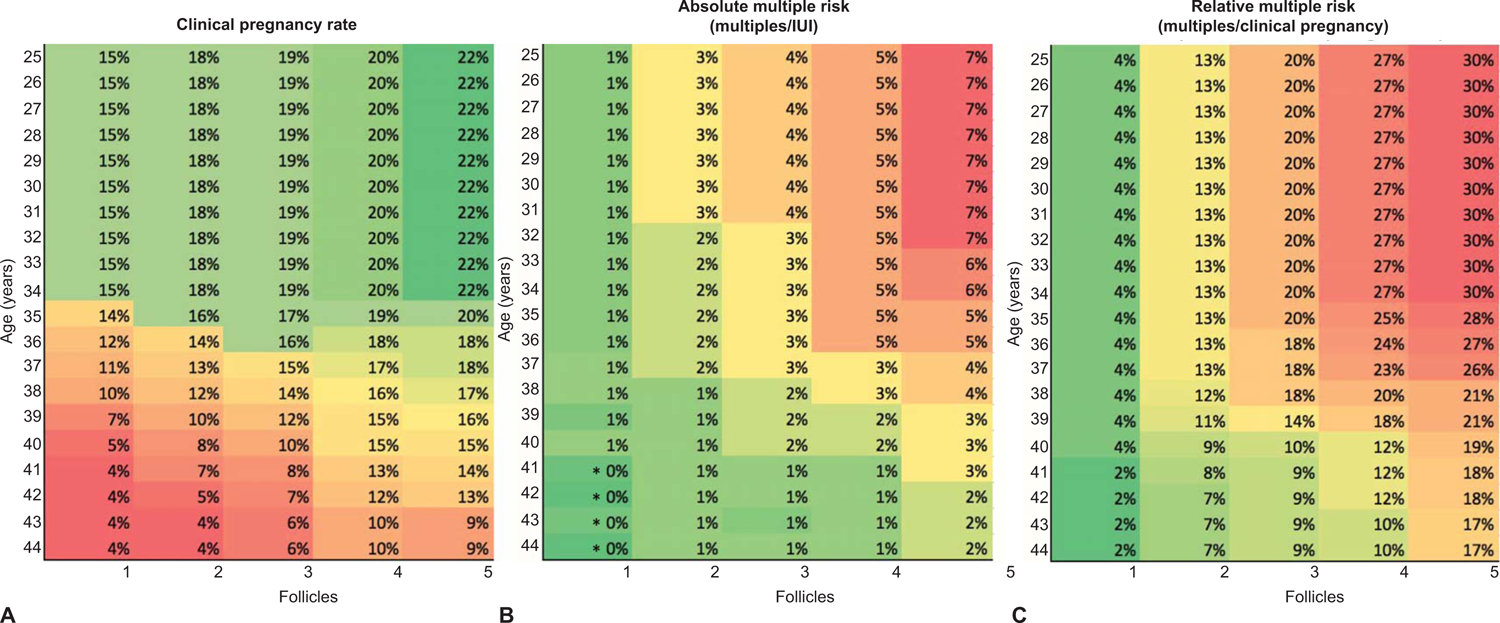
Figure 3:

Heat maps to guide clinical decisions and counseling patients on the risks versus benefits of their pregnancy outcome. Clinical pregnancy rate (A), absolute multiple risk: multiples/intrauterine insemination (IUI) (B), and relative multiple risk: multiples/clinical pregnancy (C). The red region indicates low pregnancy success or high multiples risk, yellow indicates moderate pregnancy success or multiples risk, and green indicates highest success in acquiring a pregnancy or lowest multiples risk. Follicle number across the bottom of the graphs are ≥14 mm in size. This tool can counsel the patient, based on her age and number of follicles present, what her overall clinical pregnancy rate is, absolute multiple risk (multiples/IUI), and if she became pregnant, what her risk of multiples would be (relative risk). *Percentages are rounded to the closest whole number and represent mean outcomes from the study. 95% CI of the actual risk are not shown.
