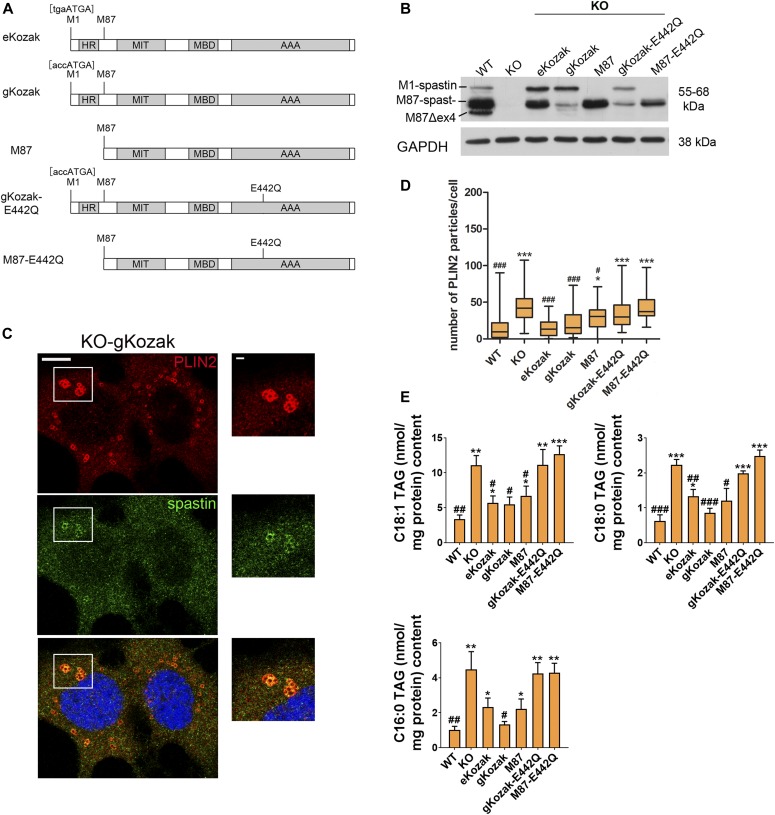
Figure 2. Spastin reexpression rescues lipid droplet and TAG accumulation.
(A) Schematic representation of the rescue constructs expressing human spastin. The positions of M1 and M87 and the Kozak sequences around the first start codon are shown. The Kozak sequence surrounding the second start codon has not been changed. (B) Representative Western blot showing spastin-M1 and M87 levels in KO cells infected with the indicated viral construct. (C) Single-plane confocal images of KO-gKozak cell line treated with oleic acid and stained for spastin (green) and PLIN2 (red). Scale bar: 10 μm. Enlargements of boxed area are shown on the right (scale bar: 1 μm). (D) Box plot of PLIN2 particles per cell (n = 3 independent experiments, ≈200 cells/genotype). One-way ANOVA with post-Tukey test: *; #P < 0.05, ***, ###P < 0.001. * refers to P versus WT, whereas # refers to P versus KO. (E) TAG content of different rescue cell lines upon HBSS starvation. Unpaired t test *; # < 0.05, **, ##P < 0.01. ***, ###P < 0.001. See also Fig S3. AAA, ATPase domain; HR, hairpin domain; MBD, microtubule-binding domain; MIT, microtubule interacting and trafficking domain.

