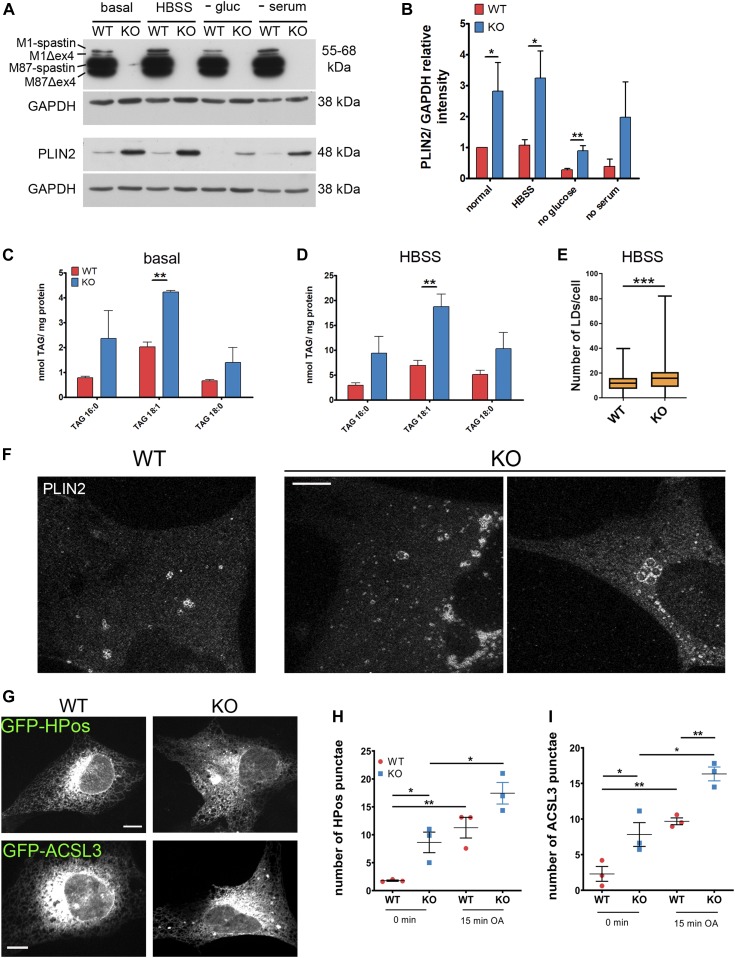
Figure 4. Spast deletion is associated with increased pre-lipid droplets (LDs).
(A) WT and spastin KO MEFs were cultured with basal medium or starved overnight as indicated and PLIN2 levels were analyzed by Western blot. (B) PLIN2 levels were normalized to GAPDH and are shown relative to the WT under basal conditions (n = 3, unpaired t test *P < 0.05, **P < 0.01). (C, D) TAG content of WT and KO cells under basal (C) and HBSS starvation conditions (D). Bars represent means ± SD of three independent biological replicates. Paired t test **P < 0.01. (E) MEFs were fed with BODIPY to trace LDs and treated with HBSS overnight. Data represent box plot of number of LDs/cell under HBSS starvation conditions of three independent biological replicates (≈300 cells/genotype). Unpaired t test ***P < 0.001. (F) Representative images of super-resolution single plane confocal images of WT and KO MEFs treated with HBSS and stained for PLIN2. Scale bar: 5 μm. (G, H, I) WT and KO MEFs were transfected with GFP-HPos or GFP-ACSL3 and serum-starved for 24 h (0 min) or further incubated for 15 min with oleic acid. (G) Representative single plane confocal images of MEFs expressing GFP-HPos or GFP-ACSL3 at 0 min Scale bar: 12 μm. (H) Quantification of HPos or (I) ACSL3 punctae at 0 min and after 15 min of oleic acid treatment. Graphs show mean ± SEM and individual data points of three independent biological replicates (in total 70 cells/genotype/condition). Unpaired t test, *P < 0.05, **P < 0.01. See also Fig S5.

