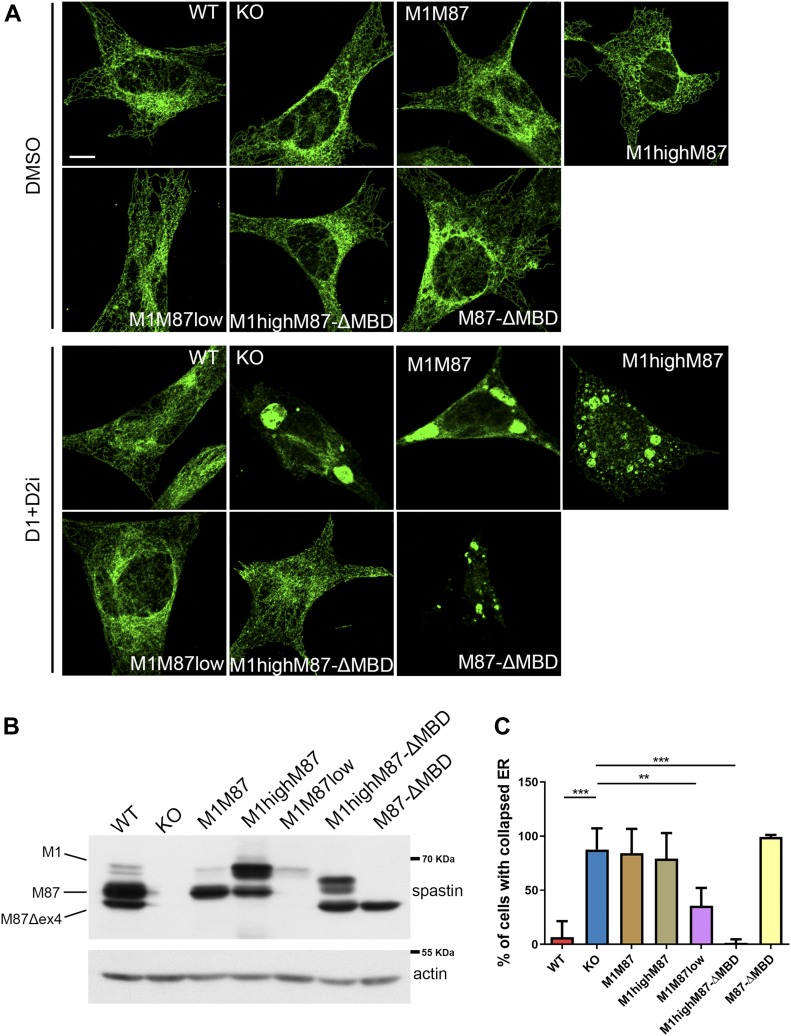
Figure 5. Increased lipid droplet biogenesis buffers lack spastin-M1 at the ER.
(A) MEF cell lines were starved in HBSS and treated either with inhibitors of DGAT1 and DGAT2 (D1+D2i) or DMSO overnight and stained with antibodies against reticulon 4. Representative single-plane confocal images. Scale bar: 10 μm. (B) Representative Western blot of spastin levels in the MEF cell lines used. (C) Bar graphs show the percentage of cells possessing collapsed ER in each cell line. Error bars represent SD. One-way ANOVA with post-Tukey test:**P < 0.01, ***P < 0.001. n = 4–5 independent experiments.

