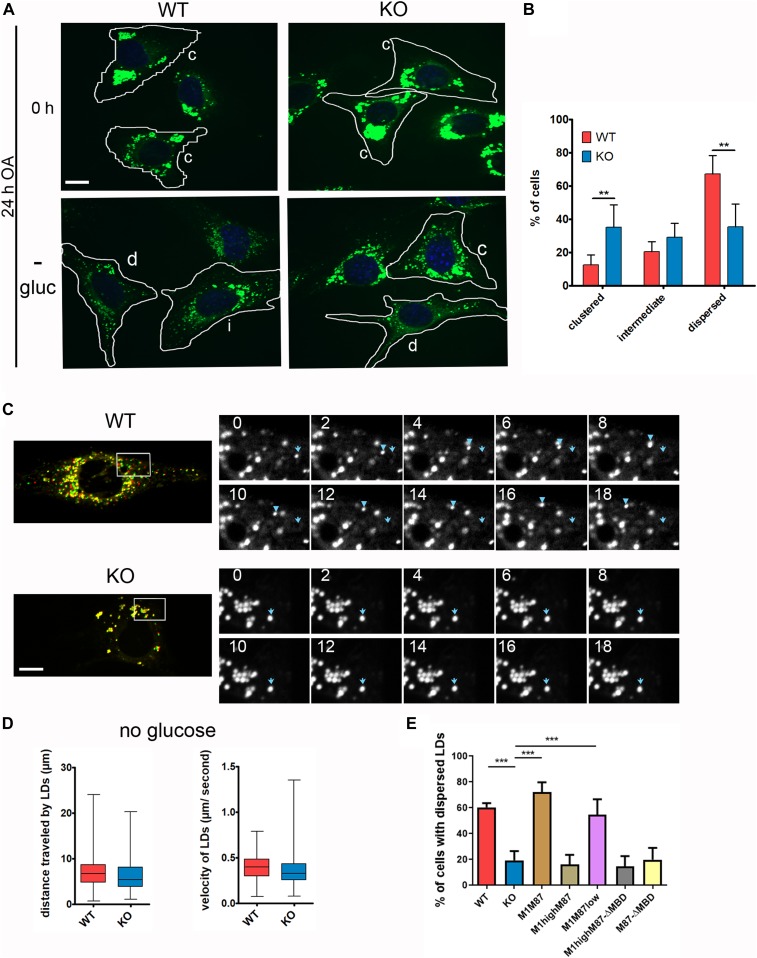
Figure 6. Spastin mediates dispersion of lipid droplets (LDs) from the ER.
(A) MEFs were fed for 24 h with oleic acid (0 h) followed by 16-h glucose starvation (−gluc) and stained with BODIPY 493/503. The cells were classified as dispersed (d), intermediate (i), or clustered (c), based on LD distribution. Dotted lines indicate cell border. Scale bar: 12 μm. (B) Distribution (%) of cells showing a dispersed, intermediate, or clustered phenotype (n = 5; ≈350 cells/genotype). Error bars represent SD. Unpaired t test, **P < 0.01, ***P < 0.001. (C) Merge of two frames 18 s apart of time-lapse movies taken after overnight glucose starvation. LDs in the first frame are labelled in red, whereas in last frame are labelled in green. LDs are highly mobile in WT, but stationary in KO cells. Scale bar: 12 μm (left). (D) Enlargements of boxed areas in (D), showing the individual frames (at 2-s intervals) of the movie. Blue arrow represents starting point of the traced LD, whereas the arrowhead marks its movement in subsequent frames (right). (D) Quantification of distance travelled and velocity of moving LDs in time-lapse movies taken after overnight glucose starvation in WT and KO MEFs. Data are shown as box and whisker plots (≈150 LDs from 30 cells/genotype: n = 3 independent experiments). (E) Bar graph shows the % of cells with dispersed LDs in the indicated MEF cell lines treated as in (A). Error bars are SD. One-way ANOVA with post-Tukey test: ***P < 0.001. n = 4 independent experiments. See also Fig S6.

