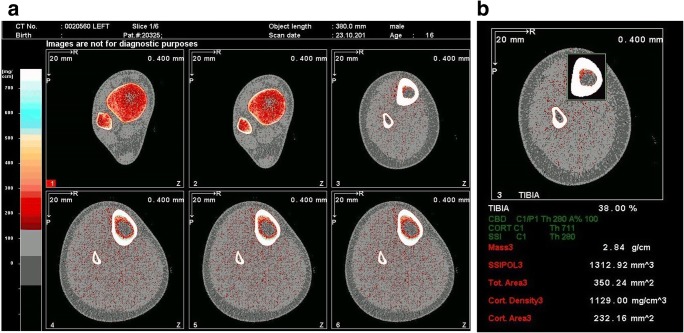
Fig. 4.
a pQCT images. This is an example of pQCT imaging of the left tibia of a 16-year-old male with chronic kidney disease. The images have been obtained at 4 different sites along the tibia. The software then proceeds to automatic analysis of the bone parameters. In this example, the images are from the 3%, 4%, 38% and 66% sites. b This is an example of the analysis of the 38% site of the left tibia of a 16-year-old male with chronic kidney disease. In this particular analysis, the total mass, total area, cortical area and cortical density have been given

