Fig. 3.
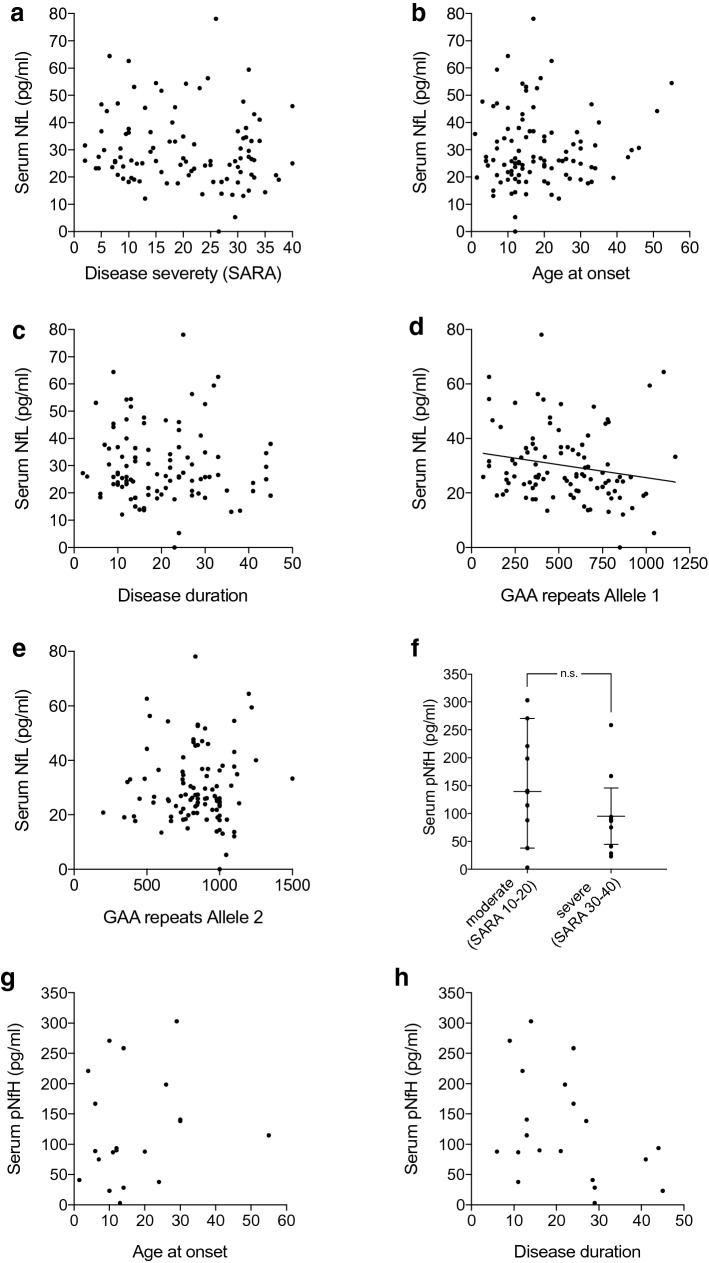
NfL and pNfH do not correlate with disease severity, age at onset or disease duration in Friedreich’s ataxia. a Serum NfL levels versus disease severity in Friedreich’s ataxia, quantified by SARA. b Correlation of serum NfL levels with age at symptom onset. c Serum NfL versus disease duration, defined by the interval between first reported symptoms and blood sampling. d Correlation of serum NfL levels with the repeat length of the shorter allele and e with the longer allele. f Quantification of serum pNfH levels versus disease severity in patients with Friedreich’s ataxia that were a priori categorized as moderately (SARA 10–20) or severely (SARA 30–40) affected. g Correlation of pNfH with age at onset, and h with disease duration. Data in f represent median and 95% confidence interval. A linear regression line is only depicted in graphs presenting a statistically significant correlation. NfL neurofilament light chain, pNfH phosphorylated neurofilament heavy chain, SARA scale for the assessment and rating of ataxia, ns not significant

