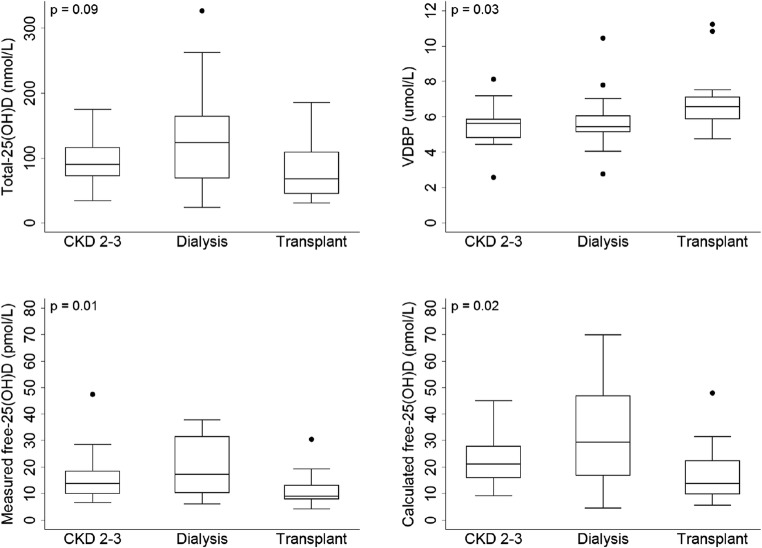
Fig. 1.
Serum concentrations of total 25-hydroxyvitamin D (25(OH)D), vitamin D-binding protein (VDBP), measured and calculated free-25(OH)D by CKD stages. Between groups of p values (Kruskal-Wallis). Mann Whitney p values: [CKD 2–3 vs. dialysis: total-25(OH)D: p = 0.19; VDBP: p = 0.81; measured free-25(OH)D p = 0.27; calculated free-25(OH)D p = 0.18]; [CKD 2–3 vs. transplant: Total-25(OH)D: p = 0.15; VDBP: p = 0.01; measured free-25(OH)D p = 0.01; calculated free-25(OH)D p = 0.02]; [dialysis vs. transplant: total-25(OH)D: p = 0.06; VDBP: p = 0.04; measured free-25(OH)D p = 0.01; calculated free-25(OH)D p = 0.03]

