Figure 4.

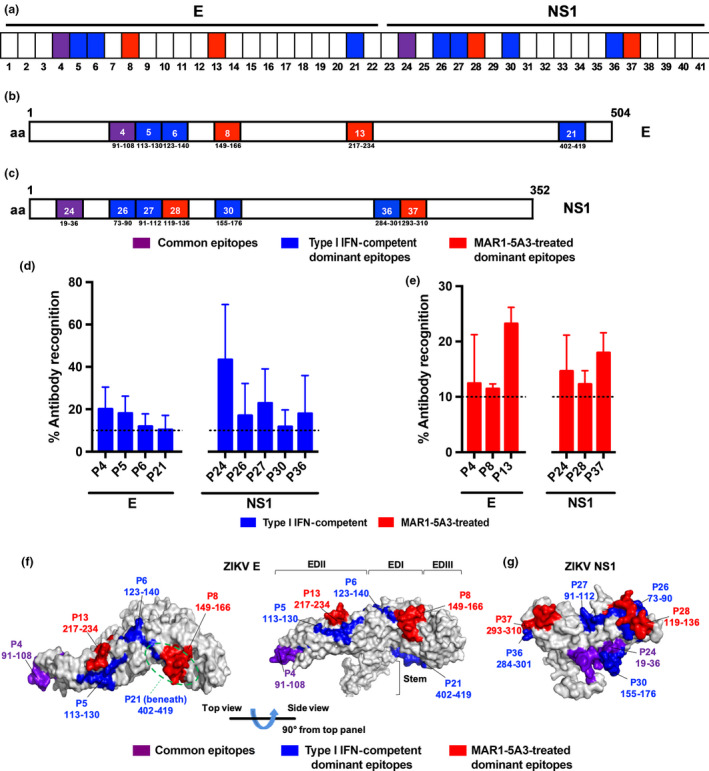
Mapping of ZIKV B‐cell linear epitopes within the ZIKV proteome. (a–e) Pooled sera at 45 dpi from type I IFN‐competent (n = 5) and MAR1‐5A3‐treated (n = 5) WT mice were tested at 1:250 by peptide‐based ELISA, using peptides that cover the E (peptides 1–22) and NS1 (peptides 23–41) of the ZIKV proteome. (a) A schematic representation to denote type I IFN‐competent dominant (in blue), MAR1‐5A3‐treated dominant (in red) and common (in purple) peptides across E and NS1. Regions of amino acids corresponding to the identified B‐cell linear epitopes in (b) ZIKV E and (c) NS1 are shown. Numbers in boxes denote the peptide number, and the amino acid position in the respective proteome. (d) Peptides plotted are those that are highly recognised (> 10%) by ZIKV‐specific antibodies from type I IFN‐competent or (e) MAR1‐5A3‐treated groups. Data are presented as mean ± SEM of three independent experiments with five animals per group per experiment. Percentage of antibody recognition was calculated according to this equation: % antibody recognition = 100 × (OD values from individual peptide group/sum of OD values from all peptide groups within the same antigen). Localisation of highly recognised ZIKV B‐cell linear epitopes on (f) ZIKV E monomer and (g) NS1 monomer based on the structural data retrieved from PDB records: 5IZ7 and 5K6K, respectively. Peptide regions recognised by type I IFN‐competent WT mice sera are in blue, while those of MAR1‐5A3‐treated WT mice sera are in red. Commonly recognised peptides are denoted in purple.
