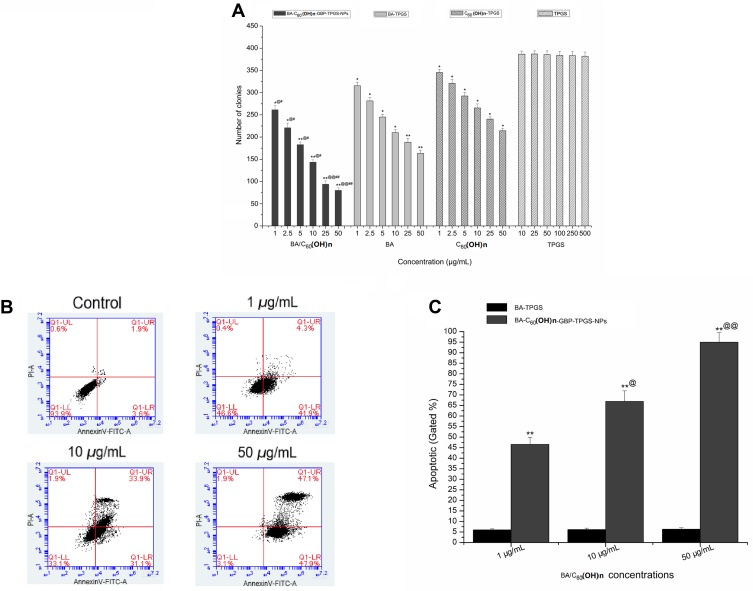
Figure 5.
MHCC97H cells proliferation assays and apoptosis analysis. (A) Colony formation assay. *p < 0.05, **p < 0.01, versus colony number of cells treated with BA-C60(OH)n-GBP-TPGS-NPs, BA-TPGS or C60(OH)n-TPGS at the corresponding concentration of TPGS solution using Student’s t-test. @p < 0.05, @@p < 0.01, versus colony number of cells treated with the NPs at the corresponding concentration of C60(OH)n-TPGS using Student’s t-test. #p < 0.05, ##p < 0.01, versus colony number of cells treated with the NPs at the corresponding concentration of BA-TPGS using Student’s t-test. (B, C) Flow-cytometer of cells stained with Annexin V and PI in MHCC97H cells with control (TPGS solution) or the NPs (1, 10 and 50 μg/mL BA/C60(OH)n). **p < 0.01, versus apoptotic of cell treated with control or the NPs at the corresponding concentration of TPGS solution using Student’s t-test. @p < 0.05, @@p < 0.01, versus apoptotic of cell treated with 10 or 50 μg/mL (BA/C60(OH)n) of the NPs at the corresponding concentration of 1 μg/mL (BA/C60(OH)n) of the NPs using Student’s t-test.

