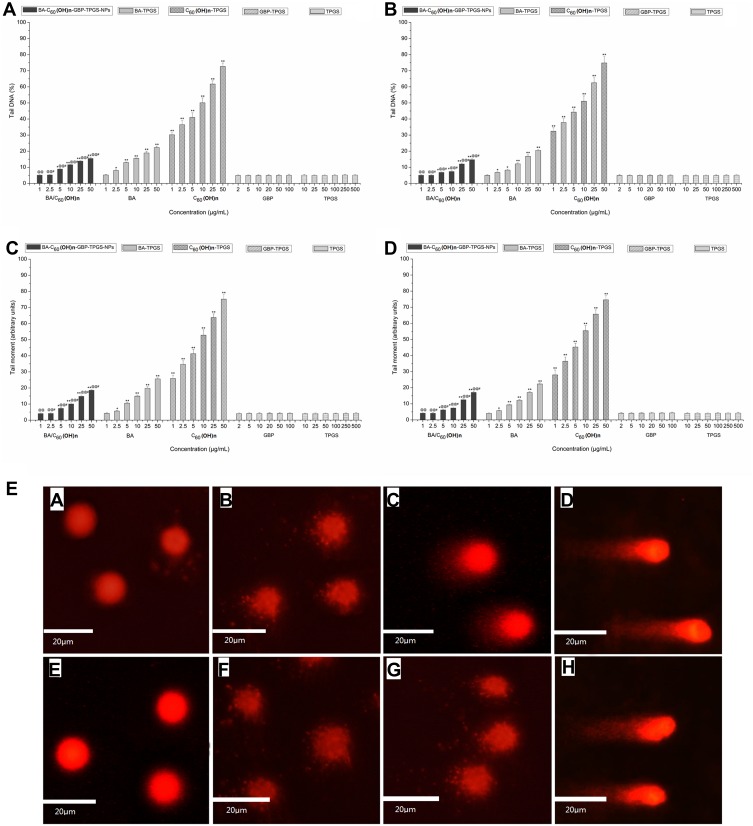
Figure 6.
DNA damage detected by comet assay. (A) on MHCC97H, by tail DNA (B) on L02 cells, by tail DNA. (C) on MHCC97H, by tail moment (D) on L02 cells, by tail moment. *p < 0.05, **p < 0.01, versus tail DNA or tail moment of cell treated with BA-C60(OH)n-GBP-TPGS-NPs, BA-TPGS or C60(OH)n-TPGS at the corresponding concentration of TPGS solution using Student’s t-test. @p < 0.05, @@p < 0.01, versus tail DNA or tail moment of cell treated with BA-C60(OH)n-GBP-TPGS-NPs at the corresponding concentration of C60(OH)n-TPGS using Student’s t-test. #p < 0.05, versus tail DNA or tail moment of cell treated with BA-C60(OH)n-GBP-TPGS-NPs at the corresponding concentration of BA-TPGS through the use of Student’s t-test. Positive control was 50 mg/mL tBOOH. Tail DNA (%) was above 95% and tail moment was above 98. Values express mean ± SD (n= 3). E. Representative photos of DNA damage. MHCC97H cells: a. negative control (TPGS solution); b. 1 μg/mL (BA/C60(OH)n) of the NPs; c. 10 μg/mL (BA/C60(OH)n) of the NPs; d. 50 μg/mL (BA/C60(OH)n) of the NPs. L02 cells: e. control (TPGS solution); f. 1 μg/mL (BA/C60(OH)n) of the NPs; g. 10 μg/mL (BA/C60(OH)n) of the NPs; h. 50 μg/mL (BA/C60(OH)n) of the NPs.

