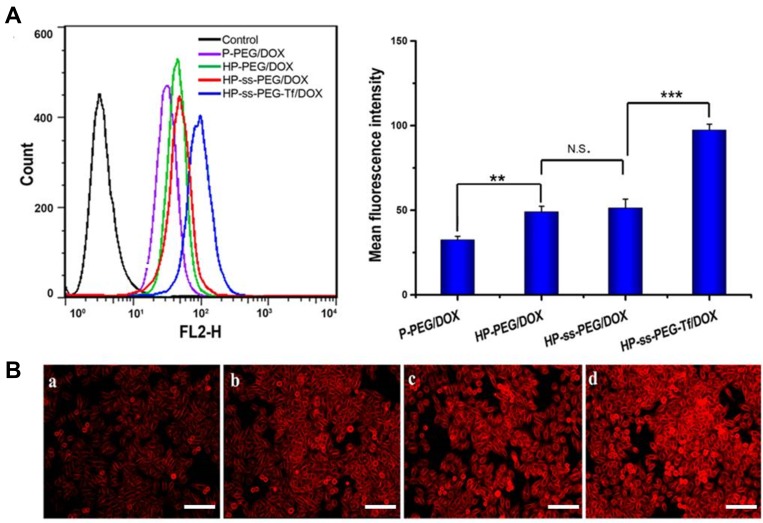
Figure 4.
(A) Flow cytometry of HepG2 cells after 2 h incubation with the DOX-loaded complexes. Data are presented as mean ± SD. (n = 3, **P <0.01, ***P <0.001, N.S.: no significance). (B) Fluorescence microscope images of HepG2 cells after 2 h incubation with the DOX-loaded complexes (×100): (a) P-PEG/DOX, (b) HP-PEG/DOX, (c) HP-ss-PEG/DOX and (d) HP-ss-PEG-Tf/DOX (bar: 100 μm).

