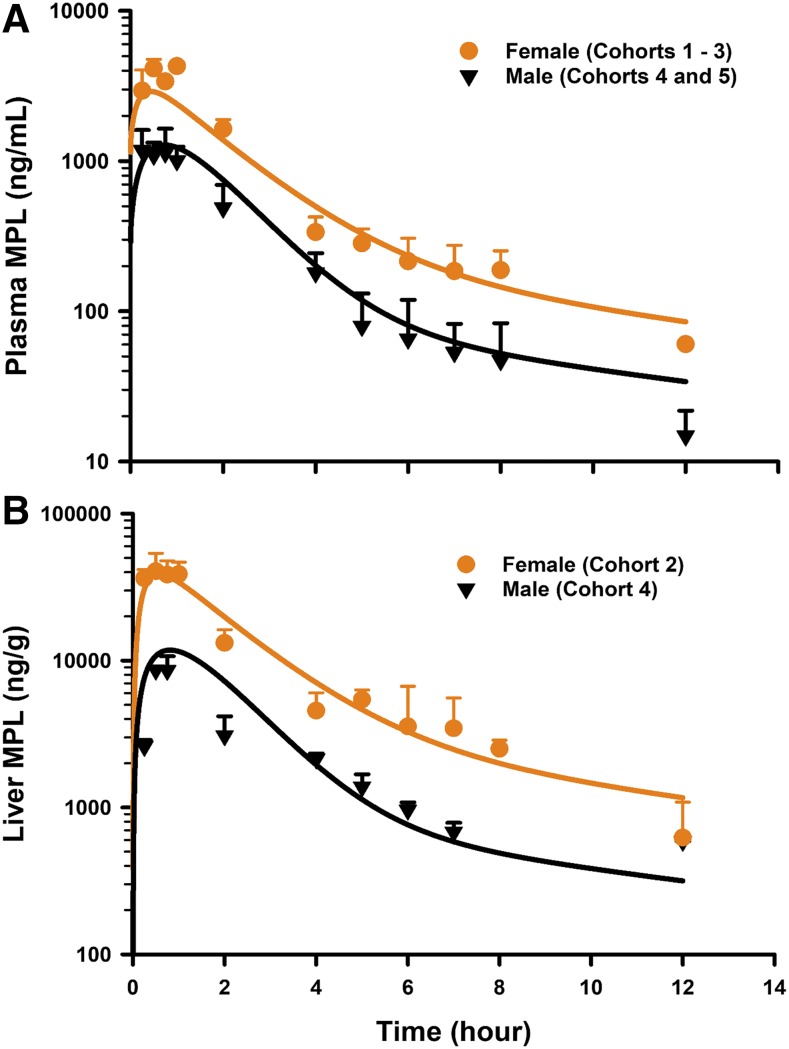
Fig. 3.
Model fittings of the concentration–time profiles of total MPL in plasma (A) and liver (B) of male and female rats that received 50 mg/kg IM doses of MPL. Symbols depict mean observed data ± S.D. Solid lines represent model-fitting results for each sex. Symbols are defined within the figure.

