
Figure 1. Endogenous H2O2 levels oscillate rhythmically in cells and in mouse livers.
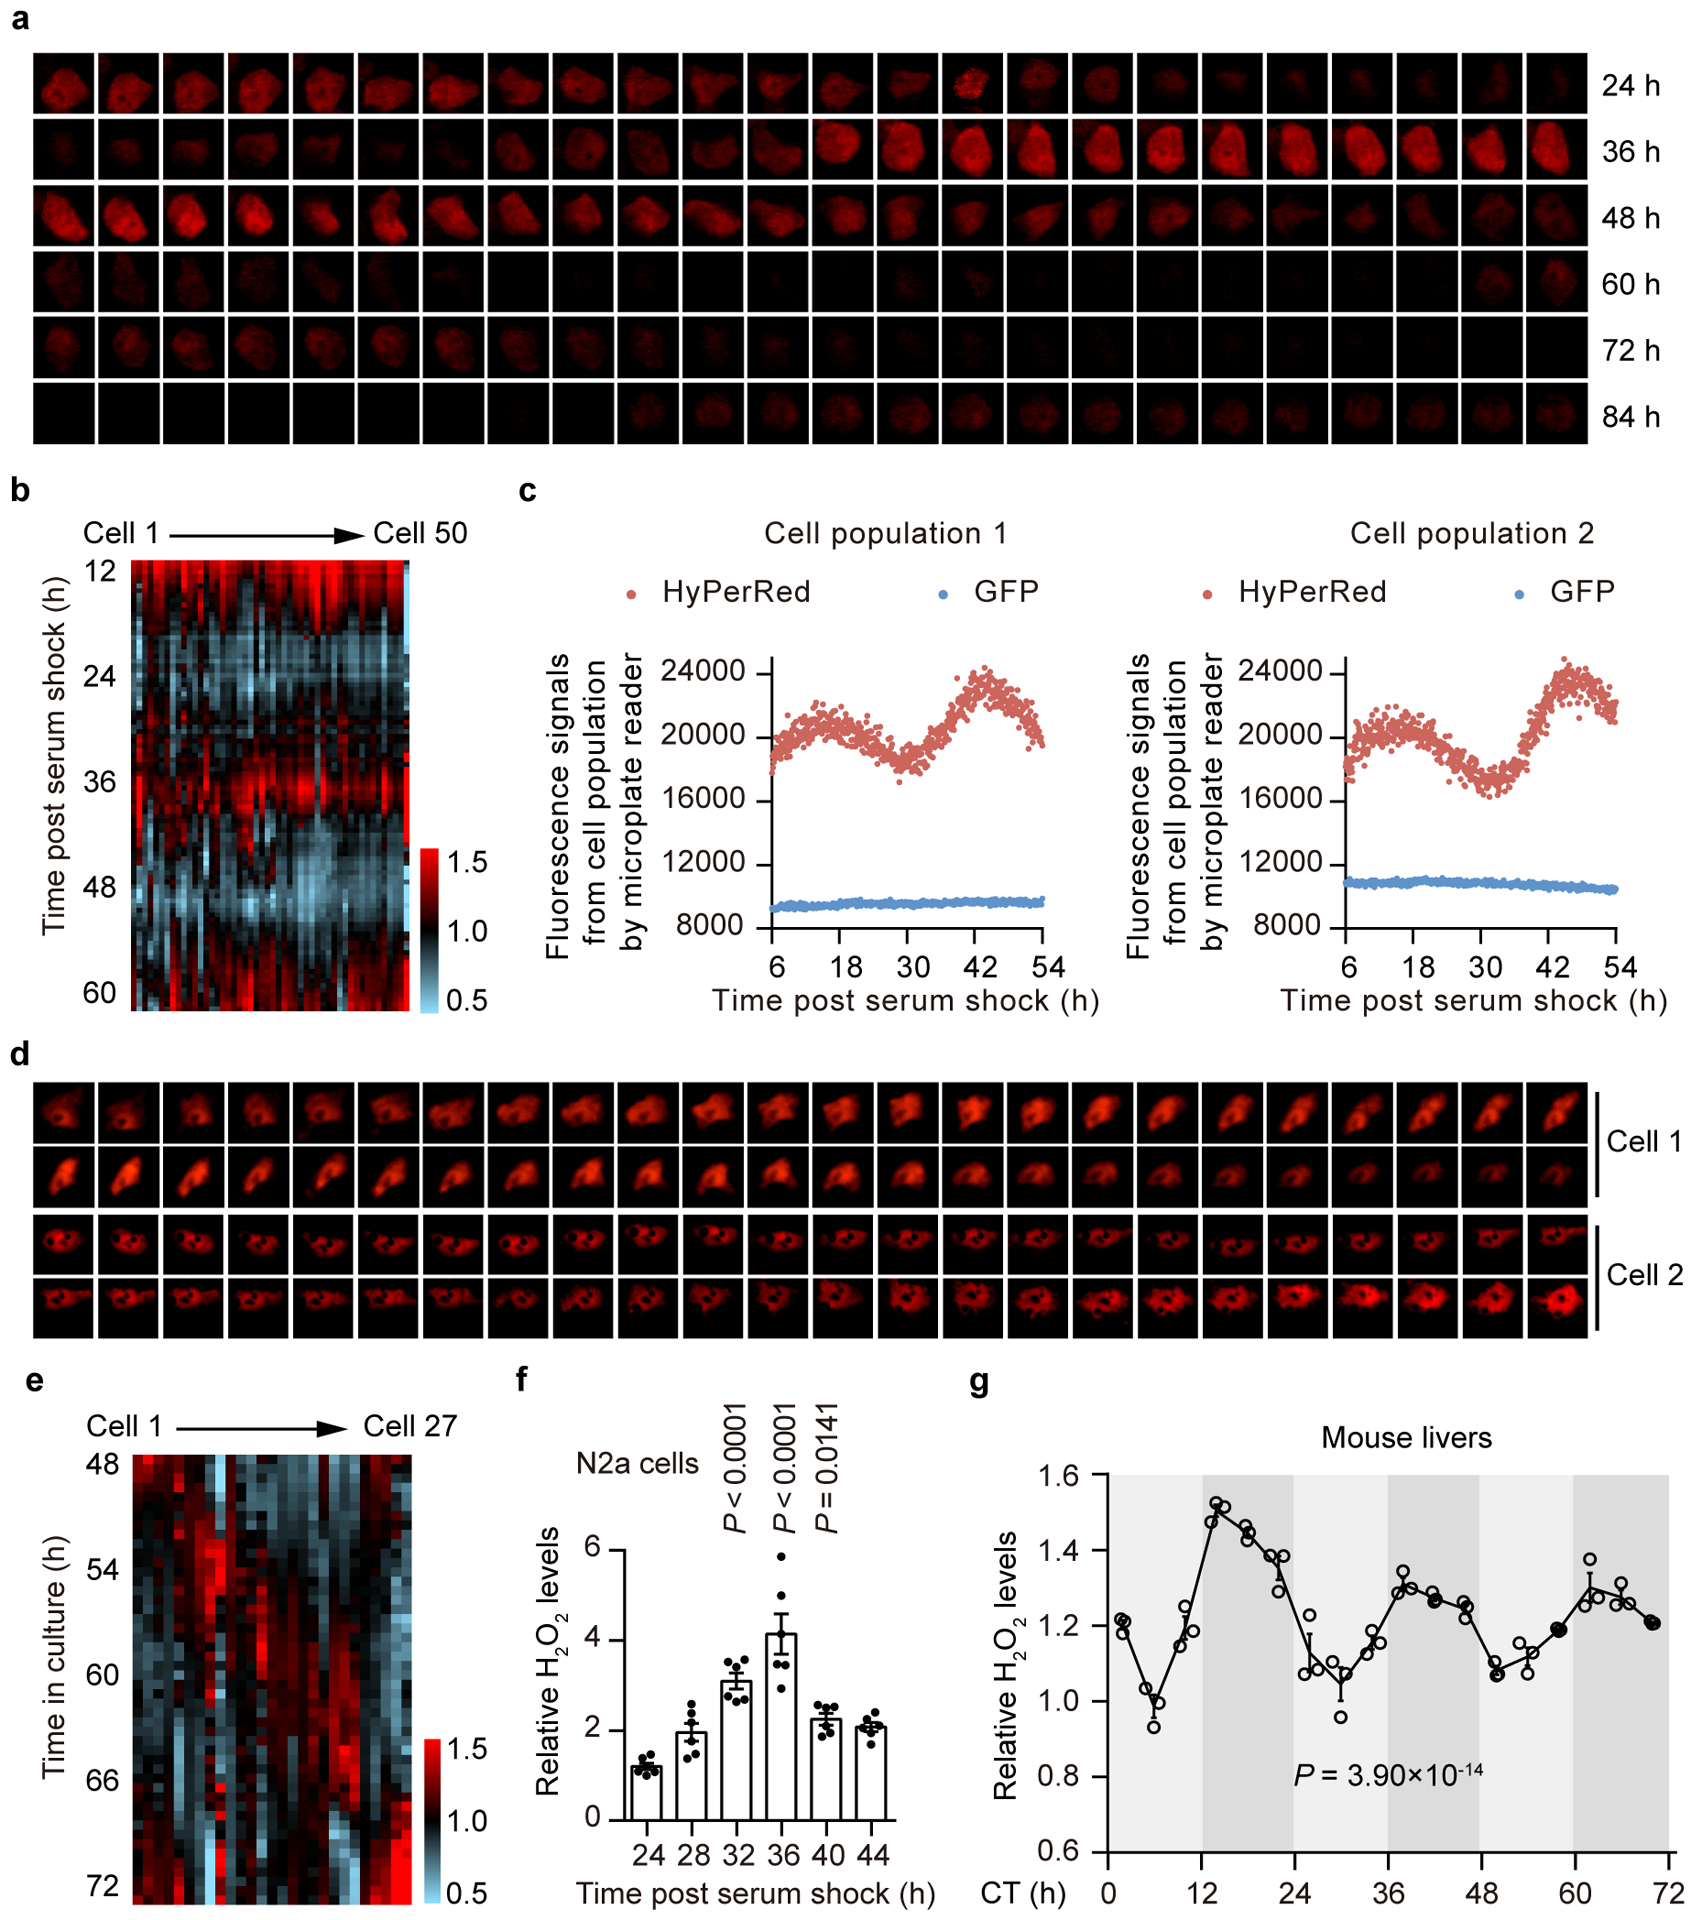
a,d, Time-lapse microscopy of circadian HyPerRed fluorescence in an individual cell for three consecutive days post serum shock (a) or in two individual cells for 24 h without serum shock (d). Images were obtained every 30 minutes (min) (n = 3 independent experiments with similar results). b,e, Circadian fluorescence profiles of HyPerRed from n = 50 individual cells post serum shock (b) or n = 27 individual cells without serum shock (e). Note that fluorescence intensity varies dramatically between cells. Fluorescence intensity was quantified and plotted against time after normalization to mean values of individual cells. c, Fluorescent signals of HyPerRed and GFP under the same promoter in the same U2OS cell population at 5-min intervals for two days post serum shock (n = 3 independent experiments with similar results). f, Concentration of H2O2 in N2a cells determined by Amplex Red at 4-h intervals for one circadian cycle post serum shock. Data are presented as the means ± standard errors of the means (SEM) (n = 6 independent biological samples per time point). P values are shown for the comparisons to 24 h by one-way analysis of variance (ANOVA) with a Bonferroni’s post hoc test. g, Concentration of H2O2 in mouse livers determined by Amplex Red at 4-h intervals over a 72-h period under DD conditions. Data are presented as the means ± SEM (n = 3 independent biological samples per time point). JTK _Cycle analysis was used to determine rhythmicity, and P < 0.05 was considered rhythmic. Source data are provided in Statistics Source Data Figure 1.