
Figure 1.
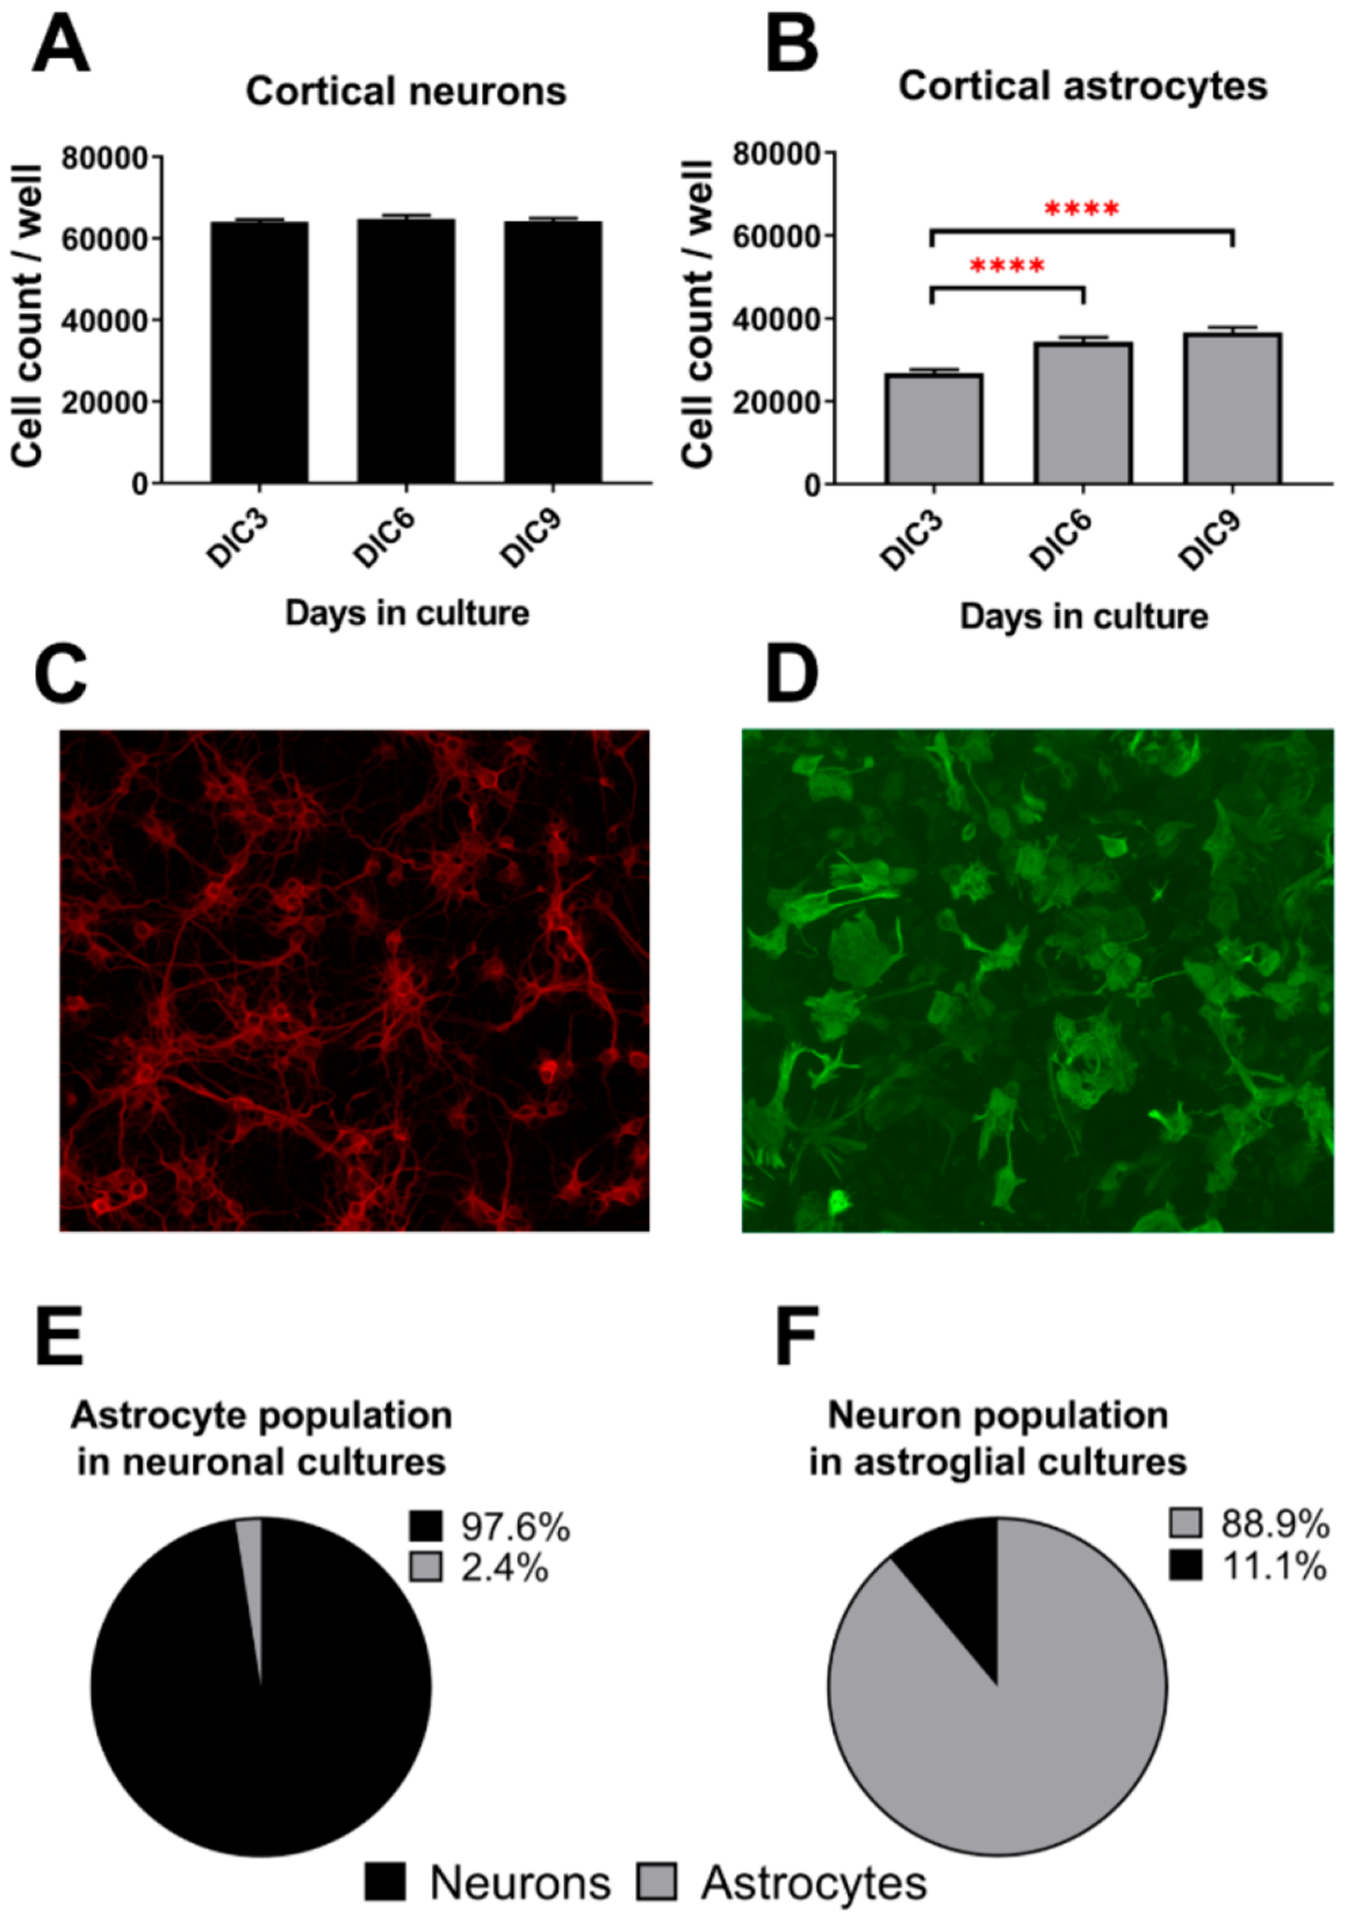
Neuronal and astroglial cultures. Panels A and B show cell counts of neurons and astrocytes at different time points, respectively. Panels C and D show representative images of neurons and astrocytes in the culture wells. Neurons were labeled with anti-MAP2 antibody while astrocytes were stained with anti-GFAP antibody. Images were acquired with 20× and 40× objectives, respectively. Panels E and F denote the percent of astrocytes in neuronal cultures and the percent of neurons in astroglial cultures at 6 days in culture (DIC6), respectively. The absolute numbers of neurons and astrocytes in cultures, with statistical measures, are reported in Supplemental Table 1.