
Fig. 2 –
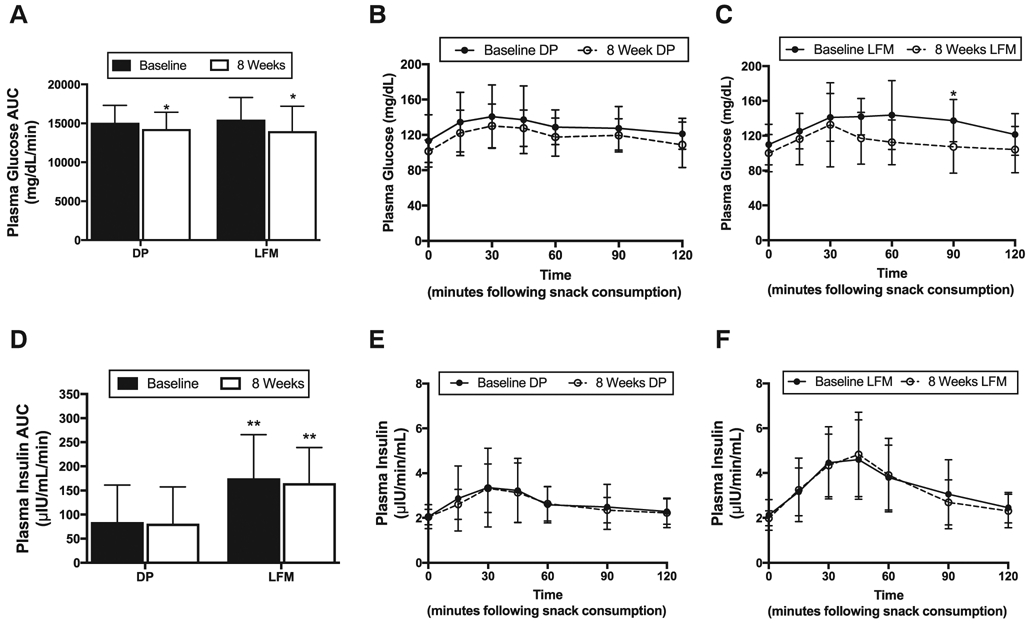
(A) Plasma glucose AUC at baseline (closed bars) and 8 weeks (open bars) in the DP and LFM groups. (B) Glucose responses to dried plums at baseline (•) and 8-weeks (°), and (C) low-fat muffins at baseline (•) and 8-weeks (°). (D) Plasma insulin AUC at baseline (closed bars) and 8 weeks (open bars) in the DP and LFM groups. (E) Plasma insulin responses to dried plums at baseline (•) and 8-weeks (°), and (F) low-fat muffins at baseline (•) and 8-weeks (°). Significant (P < .05) within group differences are indicated by a single asterisk (*) and significant between group differences are indicated by two asterisks (**). Values are means ± SD. Error bars reflect standard deviations. (DP: n = 24; LFM: n = 21).