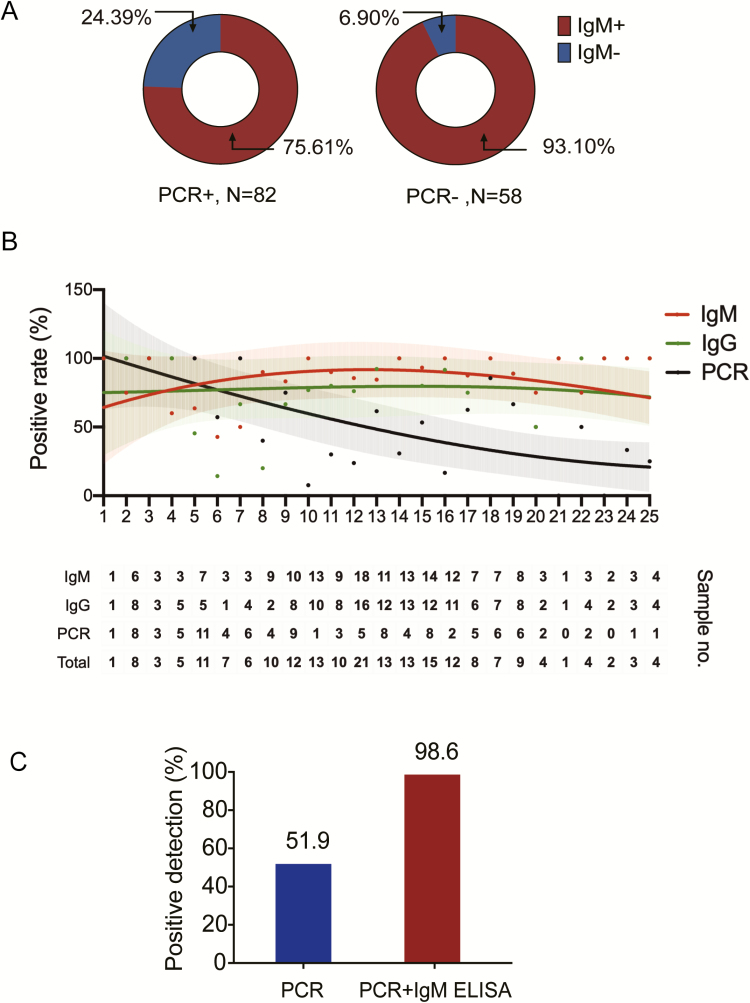
Figure 4. .
IgM ELISA to diagnose patients infected with COVID-19. A, IgM antibody detection using ELISA in patients who were either PCR positive (82 cases) or who tested negative for the virus by qPCR (58 cases). Red indicates IgM positive while blue indicates IgM negative. B, Fitted curve of the positive detection by PCR and IgM or IgG ELISA on different days after symptom onset. The fitted curves were created by the Fit Spline program of Graphpad Software. The 95% confidence intervals are shown for each curve. The dots in the upper panel represent positive rates of PCR and IgM or IgG ELISA at each time point. The lower table shows the number of samples that tested positive at each time point. The first intersection of the real-time PCR method and IgM ELISA was found to be at 5.5 days. C, The positive detection rate of cases using the PCR method versus PCR plus IgM ELISA assay. Abbreviations: COVID-19, coronavirus disease 2019; ELISA, enzyme-linked immunosorbent assay; Ig, immunoglobulin; PCR, polymerase chain reaction; qPCR, quantitative polymerase chain reaction.

