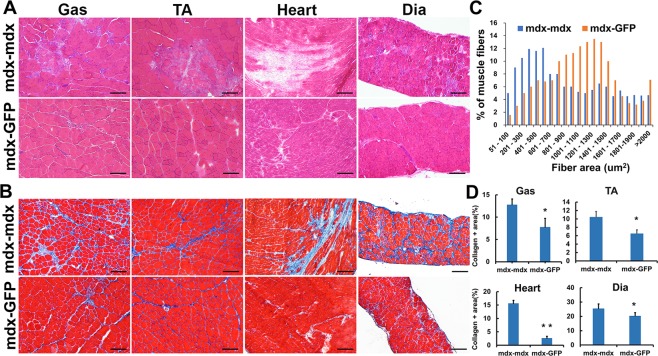
Figure 2.
Improved muscle histology in mdx mice exposed to young WT peripheral circulation. (A) H&E staining and (B) trichrome staining, representative image shows the gastrocnemius, tibialis anterior, diaphragm muscle and cardiac tissue of mdx mice. (C) Quantification of the myofiber area between the parabiont mdx and control mdx muscle. The average number of myofibers of each size range calculated from >1,000 fibers analyzed per mdx muscle (n = 6). (D) Quantification of collagen positive area. Error bars indicate ‘mean + SD’, n = 6, *p < 0.05. Scale bar = 100 µm.

