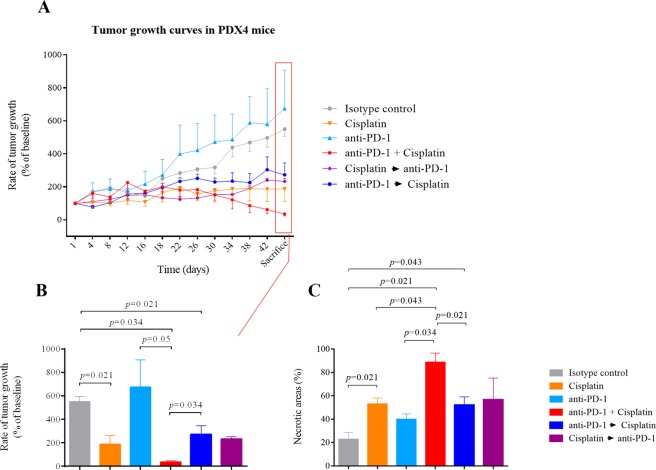
Figure 2.
Effect of different treatments on tumor (non–small cell lung carcinoma) size and on tumor necrosis in patient-derived xenograft PDX4 in NSG mice. (A) Tumor growth curves are expressed as a percentage of the change of initial tumor volume, which was considered as 100%. Each point represents a measurement day given as the mean ± SEM of the tumor volume of the mice of each group (2 tumors per mice, i.e., n = 8 tumors per group). (B) Mice were sacrificed after six weeks and the tumor volume was measured. Results are shown as mean ± SEM of the tumor volume of the mice of each group (n = 8 tumors per group). Statistical significance is indicated (p ≤ 0.05) and was analyzed by the Kruskal-Wallis non-parametric test. Post hoc between-group comparisons were made with the Mann-Whitney test. (C) The necrosis index is expressed as a percentage of tumor necrotic areas (n = 6–8 tumors per group). Values represent the percentage (mean ± SEM). Statistical significance is indicated (p ≤ 0.05) and was analyzed by the Kruskal-Wallis non-parametric test. Post hoc between-group comparisons were made with the Mann-Whitney test.

