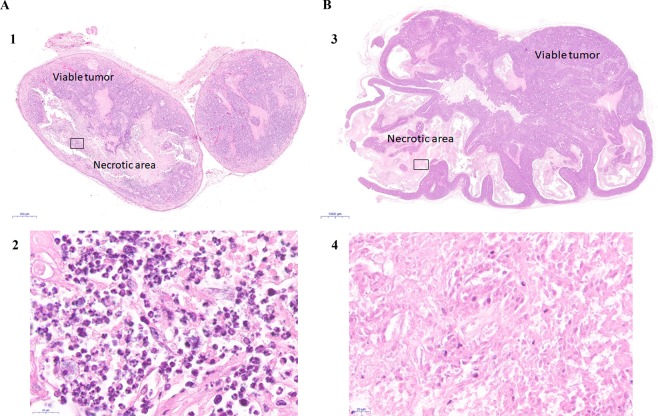
Figure 4.
Tumor PDX histologies and inflammatory response associated with tumor regression in response to anti-PD-1 treatments in ‘responder’ (PDX4, A) and ‘non-responder’ tumors (PDX6, B). (1) PDX4 tumor treated with anti-PD-1 stained with H&E (×2). (2) Amplified image of the area inside the square in (1), where necrotic areas with inflammatory cell – mainly neutrophils – infiltrates can be seen (x100). (3) PDX6 tumor treated with anti-PD-1 stained with H&E, where necrotic areas and viable tumor areas are indicated (×2). (4) Amplified image of the area inside the square in (3), where necrotic areas without inflammatory infiltrates (no neutrophils) can be seen (x100).

