Figure 5.
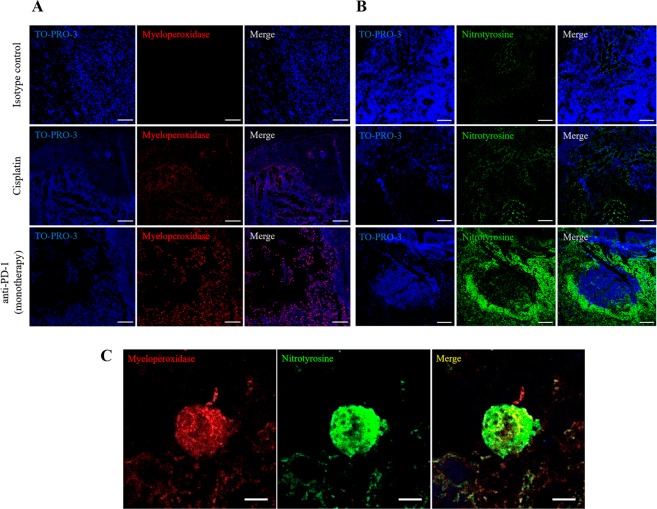
Recruitment of neutrophils and nitrotyrosine formation with anti-PD-1 treatment. (A) Representative confocal microscopy images of myeloperoxidase (red) staining of neutrophils in necrotic areas in tumors from the isotype control group, and from the experimental groups treated with cisplatin or anti-PD-1 monotherapy. Nuclei were stained with TO-PRO-3 (blue). Right panels show merged images. Scale bars, 100 µm. (B) Nitrotyrosine labeling in necrotic areas from the anti-PD-1 treatment group. Representative images of nitrotyrosine (green) localization by confocal microscopy in each study group. Nuclei were stained with TO-PRO-3 (blue). Right panels show merged images. Scale bars, 100 µm. (C) Detection of myeloperoxidase and nitrotyrosine in infiltrated tumor cells of mice treated with anti-PD-1. Representative confocal microscopy images of expression and localization of myeloperoxidase (red) and nitrotyrosine (green) in tumors from the control group and from tumors treated with anti-PD-1 monotherapy. Right panel shows merged images of co-localization (yellow). Scale bars, 5 µm.

