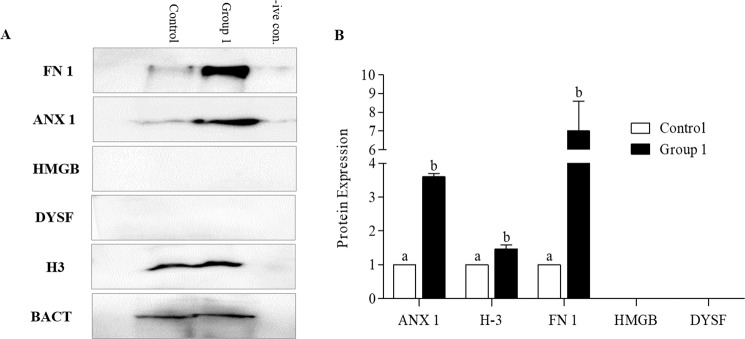
Figure 3.
Expression of proteins analysed by western blot with corresponding antibodies. (A) Representative western blot images of annexin 1 (ANX1), histone H3 (H3), fibronectin (FN1), high mobility group protein B (HMGB) and dysferlin (DYSF) proteins and (B) quantification of ANX1, H3, FN1, HMGB and DYSF protein expression levels in the Control and Ad-MSCs treated cryopreserved canine semen (Group 1). Data obtained by densitometry showing optical densities relative to the expression in Control. Beta actin expression level served as the loading control. Data are expressed as the mean ± SEM. Different lower case letters a, or b, indicate a significant difference at P < 0.05.

