Figure 3.

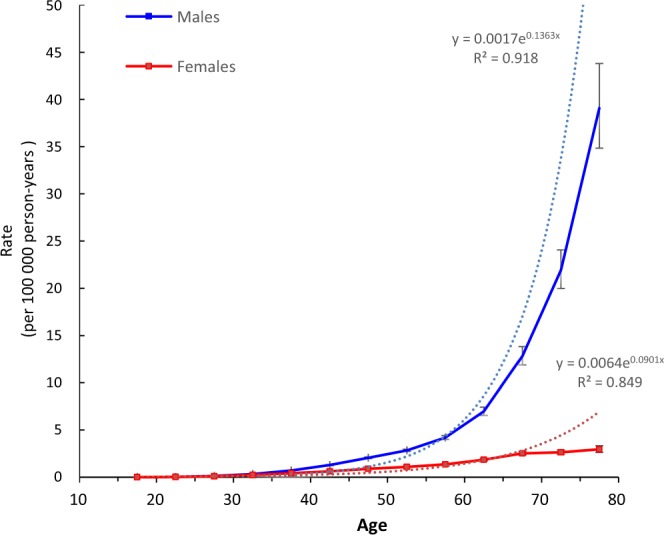
Longitudinal age curves of HIV mortality in China. Fitted longitudinal age-specific rates of HIV mortality (per 100 000 person-years) and the corresponding 95% confidence intervals (some of them were too narrow to show in the figure).

Longitudinal age curves of HIV mortality in China. Fitted longitudinal age-specific rates of HIV mortality (per 100 000 person-years) and the corresponding 95% confidence intervals (some of them were too narrow to show in the figure).