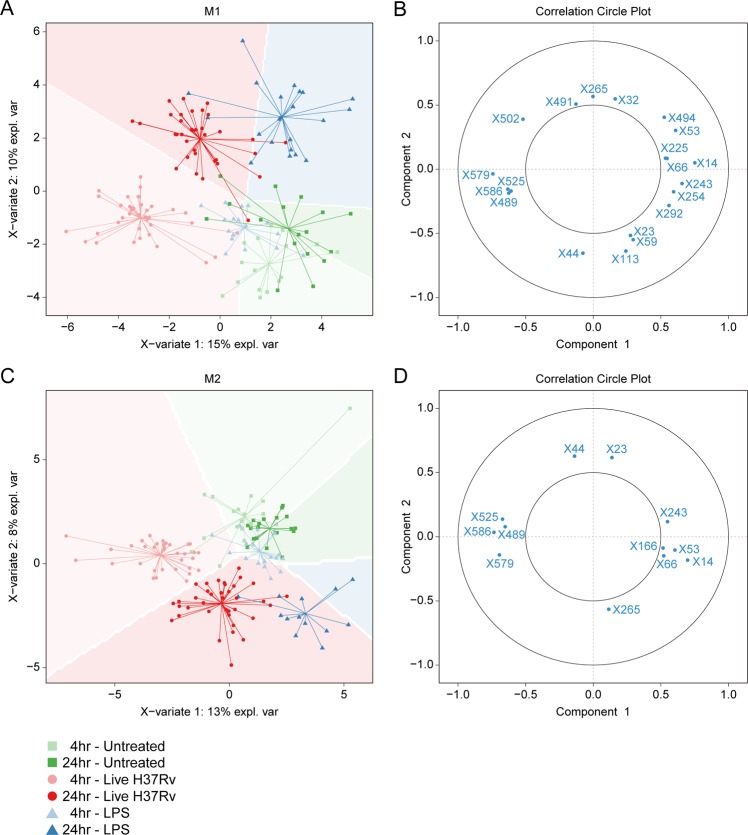
Figure 3.
Group separation by selected metabolites with high Variable Importance for Projection (VIP) scores. Multilevel PLS-DA models were fitted on all samples using a selection of 46 metabolites which reached VIP scores of ≥2 and associated regression coefficients of ≤−0.1 or ≥0.1 in any pairwise PLS-DA model described in Fig. 2. Score plots of the resulting model for M1 (A) and M2 (C) macrophages (M2) are displayed. Untreated samples are depicted as green squares, LPS stimulated samples as blue triangles and Mtb infected samples as red dots. Shade of symbol color reflects time point (4 h = light, 24 h = dark). Strongly correlated metabolites (threshold: ≥0.5) are displayed in circle plots for both the M1 (B) and the M2 (C) PLS-DA model.

