Figure 1:
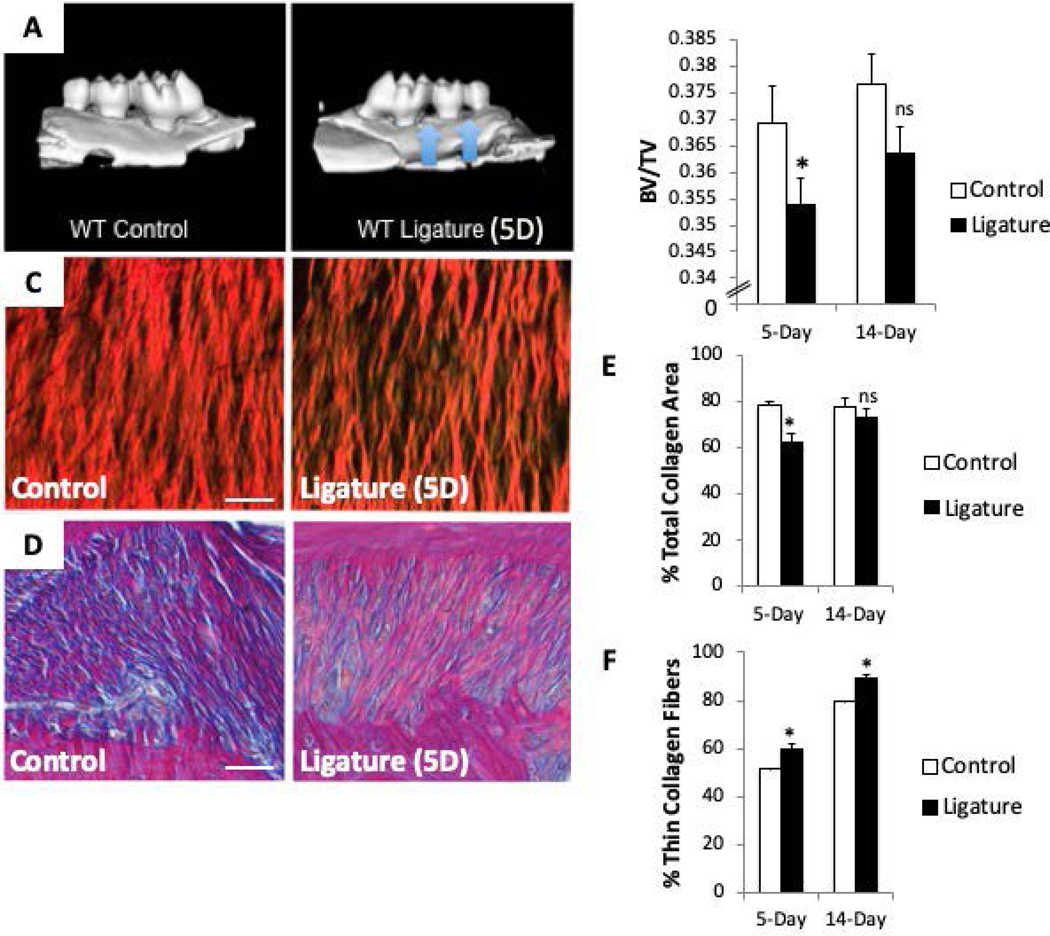
The murine ligature model significantly reduces alveolar bone volume (BV) fraction and periodontal ligament (PDL) collagen content compared to controls. A). Representative μCT images of ligature-induced alveolar bone loss around second maxillary molar (blue arrows). B). BV/Total volume (BV/TV) quantification following 5-day and 14-day ligature. C). Representative Picro Sirius Red (PSR) images of PDL following 5-day ligature. D). Representative images of Herovici-stained PDL following 5-day ligature. Pink/red = thick/mature collagen fibers, blue/purple = thin/young collagen, yellow = cell death, black = nuclei. E). Quantification of total collagen I content of PDL following 5- and 14-day ligature. F). Quantification of thin collagen fibers (green/yellow) from PSR-stained sections following 5- and 14-day ligature. Each image oriented with tooth on top, PDL centered, and alveolar bone on bottom. Images shown are of PDL surrounding second maxillary molar. *p < 0.05 between control and ligature, as determined by Student’s t test. n = 5 mice per group. Scale bars = 25 μm. Error bars = SEM. 5D = 5-day ligature

