Figure 2:
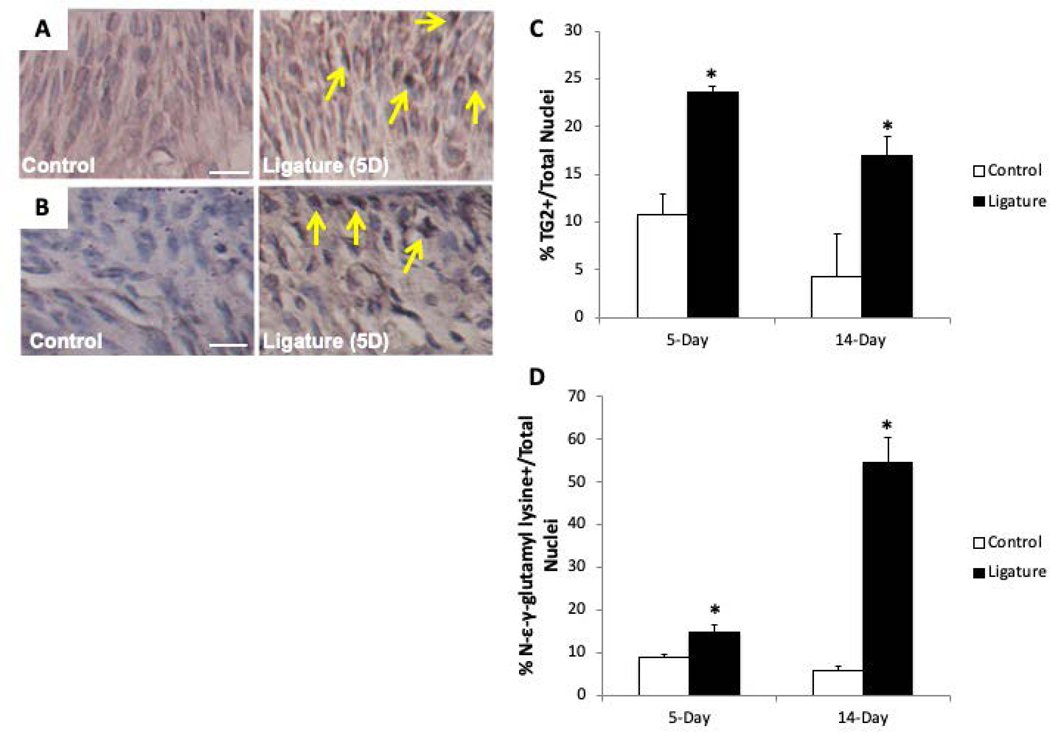
Increases in transglutaminase (TG) 2 expression and TG cross-links in PDL after 5- and 14-day ligature time points versus controls. Representative images of anti-TG2 (panel A) and anti-N-ε−γ-glutamyl lysine (panel B) immunohistochemistry (IHC) following 5-day ligature (yellow arrows). C). Quantification of TG2 and N- ε−γ-glutamyl lysine IHC based on the number of nuclei per field following 5- and 14-day ligature. Each image is oriented with tooth on top, PDL centered, and alveolar bone on bottom. Images shown are of PDL surrounding second maxillary molar. *p < 0.05 between control and ligature, as determined by Student’s t test. n = 5 mice per group. Scale bars = 30μm. Error bars = SEM. 5D = 5-day ligature.

