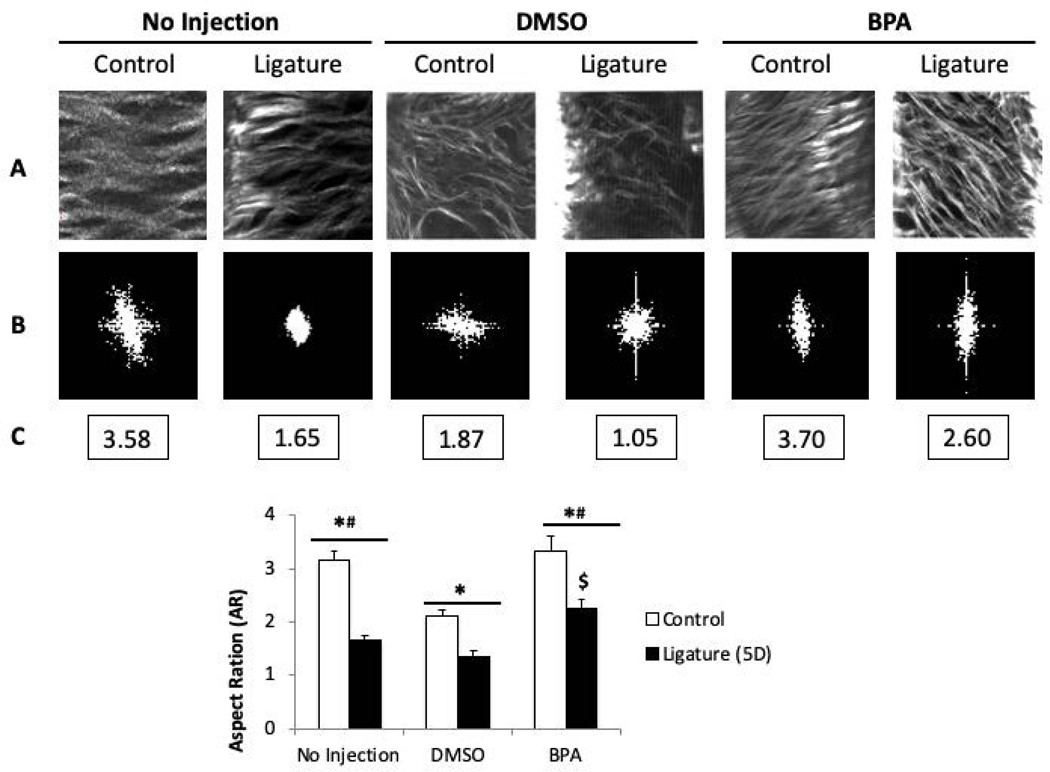
Figure 5:
Quantification of images taken with Second-Harmonic Generation (SHG) methodology demonstrates an increase in PDL collagen fiber organization following inhibition of TG. A). Representative stack of SHG images (1024×1024 μm2 ROIs) taken from PDL of mice +/−DMSO/BPA injections following 5-day ligature. B). The frequency Fourier transformation (FFT) diagram of each representative region of interes (ROI). C). The calculated value of the aspect ratio (AR) of the ellipse approximating the FFT magnitude of representative ROIs. DMSO = vehicle control; BPA = 5-(Biotinamido) pentylamine. D). Quantification of the aspect ratio (AR) of SHG z-stack images of native PDL following ligature +/− DMSO/BPA injections at 5D of ligature with treatment. *p < 0.01 between control and ligature, #p < 0.01 between DMSO and BPA, $p < 0.01 between no injection and BPA injection, as determined by Student’s t test. n = 7 mice per group. Error bars = SEM. DMSO = vehicle control; BPA = 5-(Biotinamido) pentylamine.

