
Figure 1. Identification of conserved liver cholesterol module across diverse mouse populations.
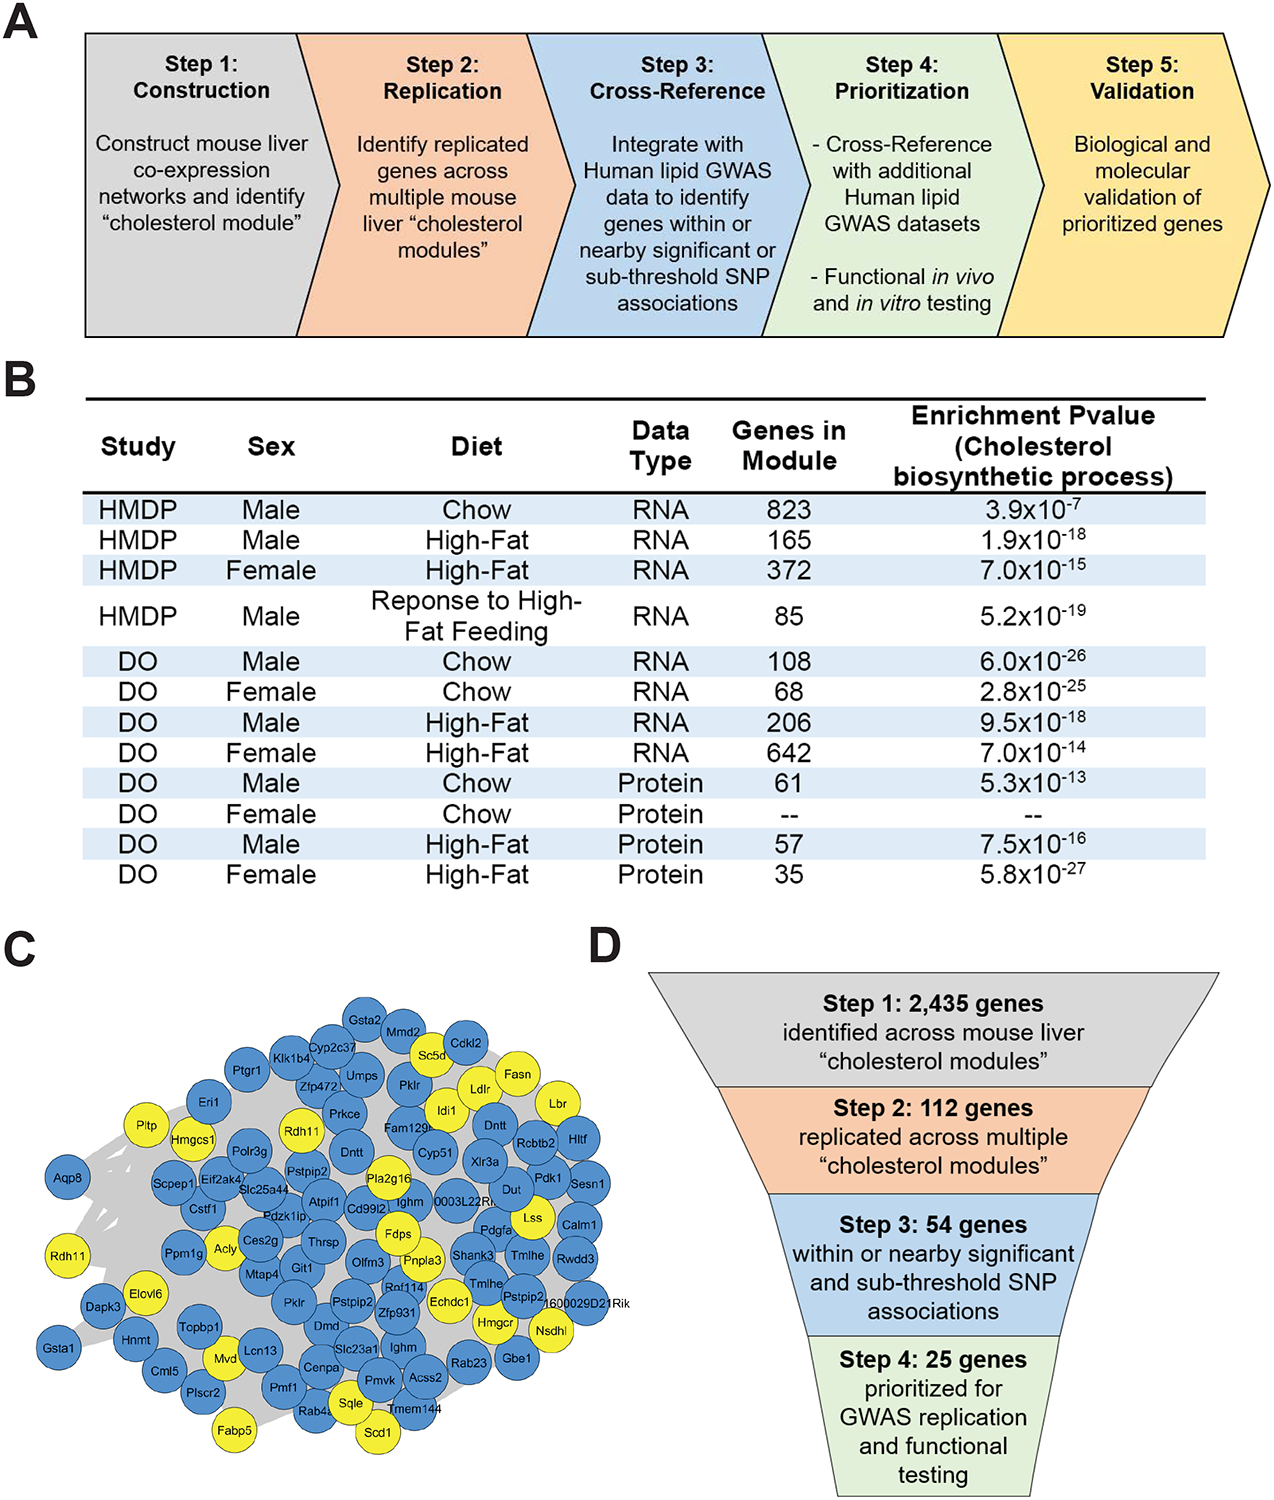
(A) Schematic diagram of stepwise approach to construct liver co-expression networks, identify replicated genes, cross-reference with human lipid GWAS datasets, prioritize genes, and validate candidate genes.
(B) Table showing liver datasets used for WGCNA analysis with indicated mouse population, sex, diet, data type, total number of genes present within the identified cholesterol module, and GO enrichment P-value for cholesterol biosynthetic process.
(C) Representative network view of cholesterol module from the HMDP male mice in response to high-fat feeding. Yellow nodes represent genes with known role in cholesterol and lipid metabolism, and blue nodes represent genes with no known role in cholesterol and lipid metabolism.
(D) Schematic diagram of our integrative stepwise approach with indicated number of genes prioritized at each step.