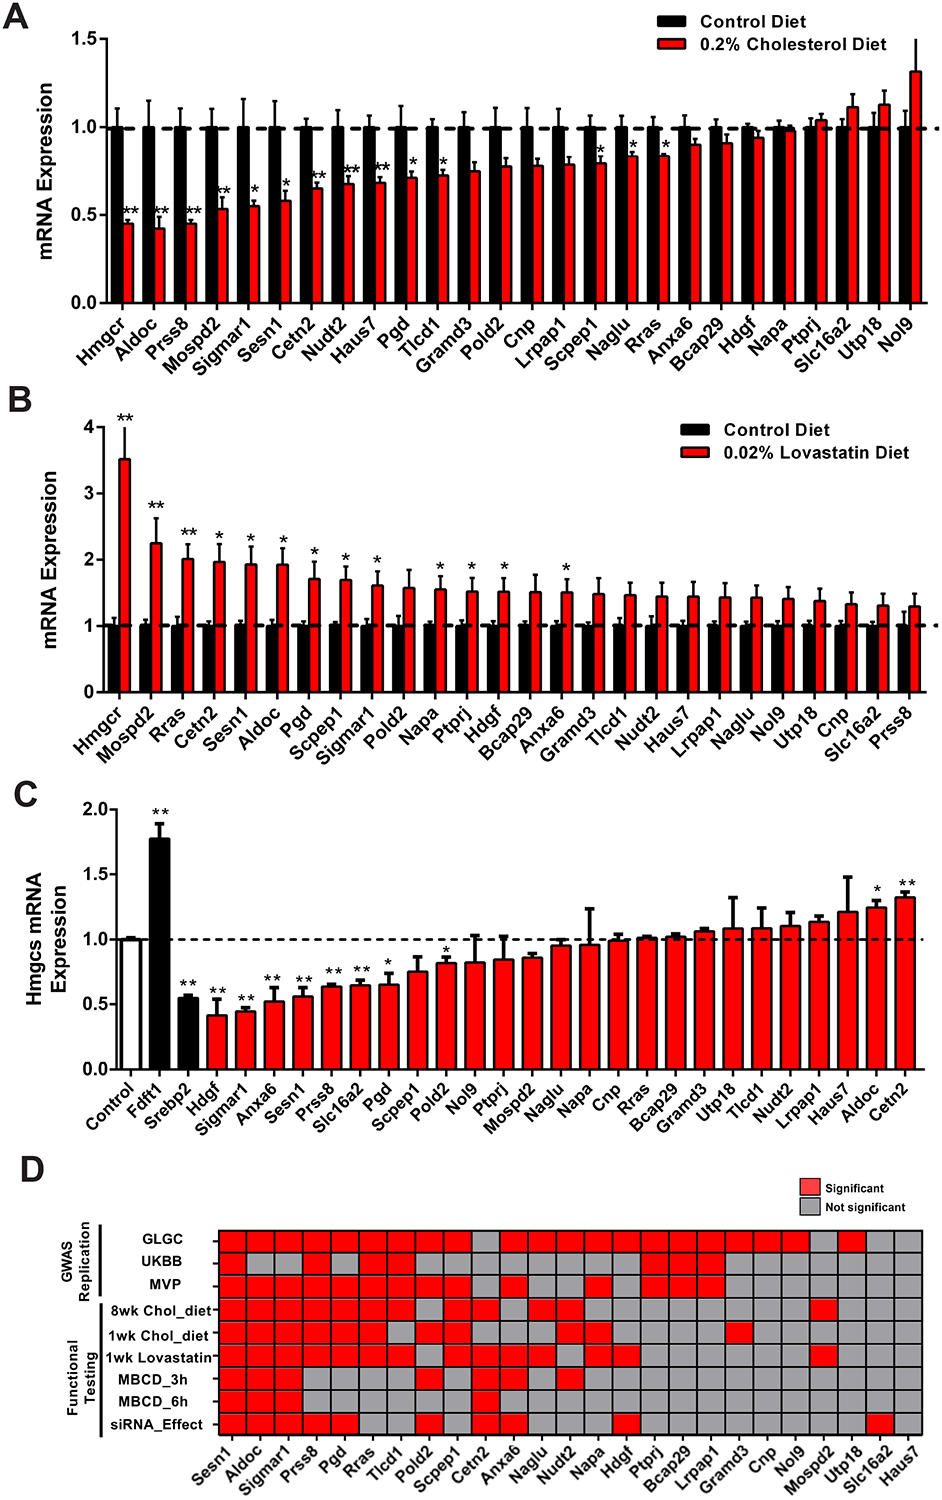
Figure 2. Functional testing and human GWAS replication of 25 prioritized genes.

(A) Liver mRNA expression of 25 prioritized genes in male mice fed a 0% (black) or 0.2% (red) cholesterol diet for eight weeks. n = 9.
(B) Liver mRNA expression levels of 25 prioritized genes after one week of 0.02% lovastatin (red) or control (black) treatment in male mice. n = 5.
(C) Hmgcs1 mRNA expression levels after silencing each of the 25 prioritized genes (red) in AML12 cells. Fdft1 and Srebp2 (black) silence was used as positive and negative control. n = 3.
(D) GWAS replication and Functional Testing. Graphical representation of 25 prioritized genes showing association in three human lipid GWAS (GLGC, MVP and UKBB-500K), red indicates significant or sub-threshold association, gray indicates no association. For functional testing, graphical representation of prioritized genes showing significance, red indicates statistical significance (P < 0.05) and gray indicates not significance.
Data represented is mean ± SE. **P < 0.01, *P < 0.05.
