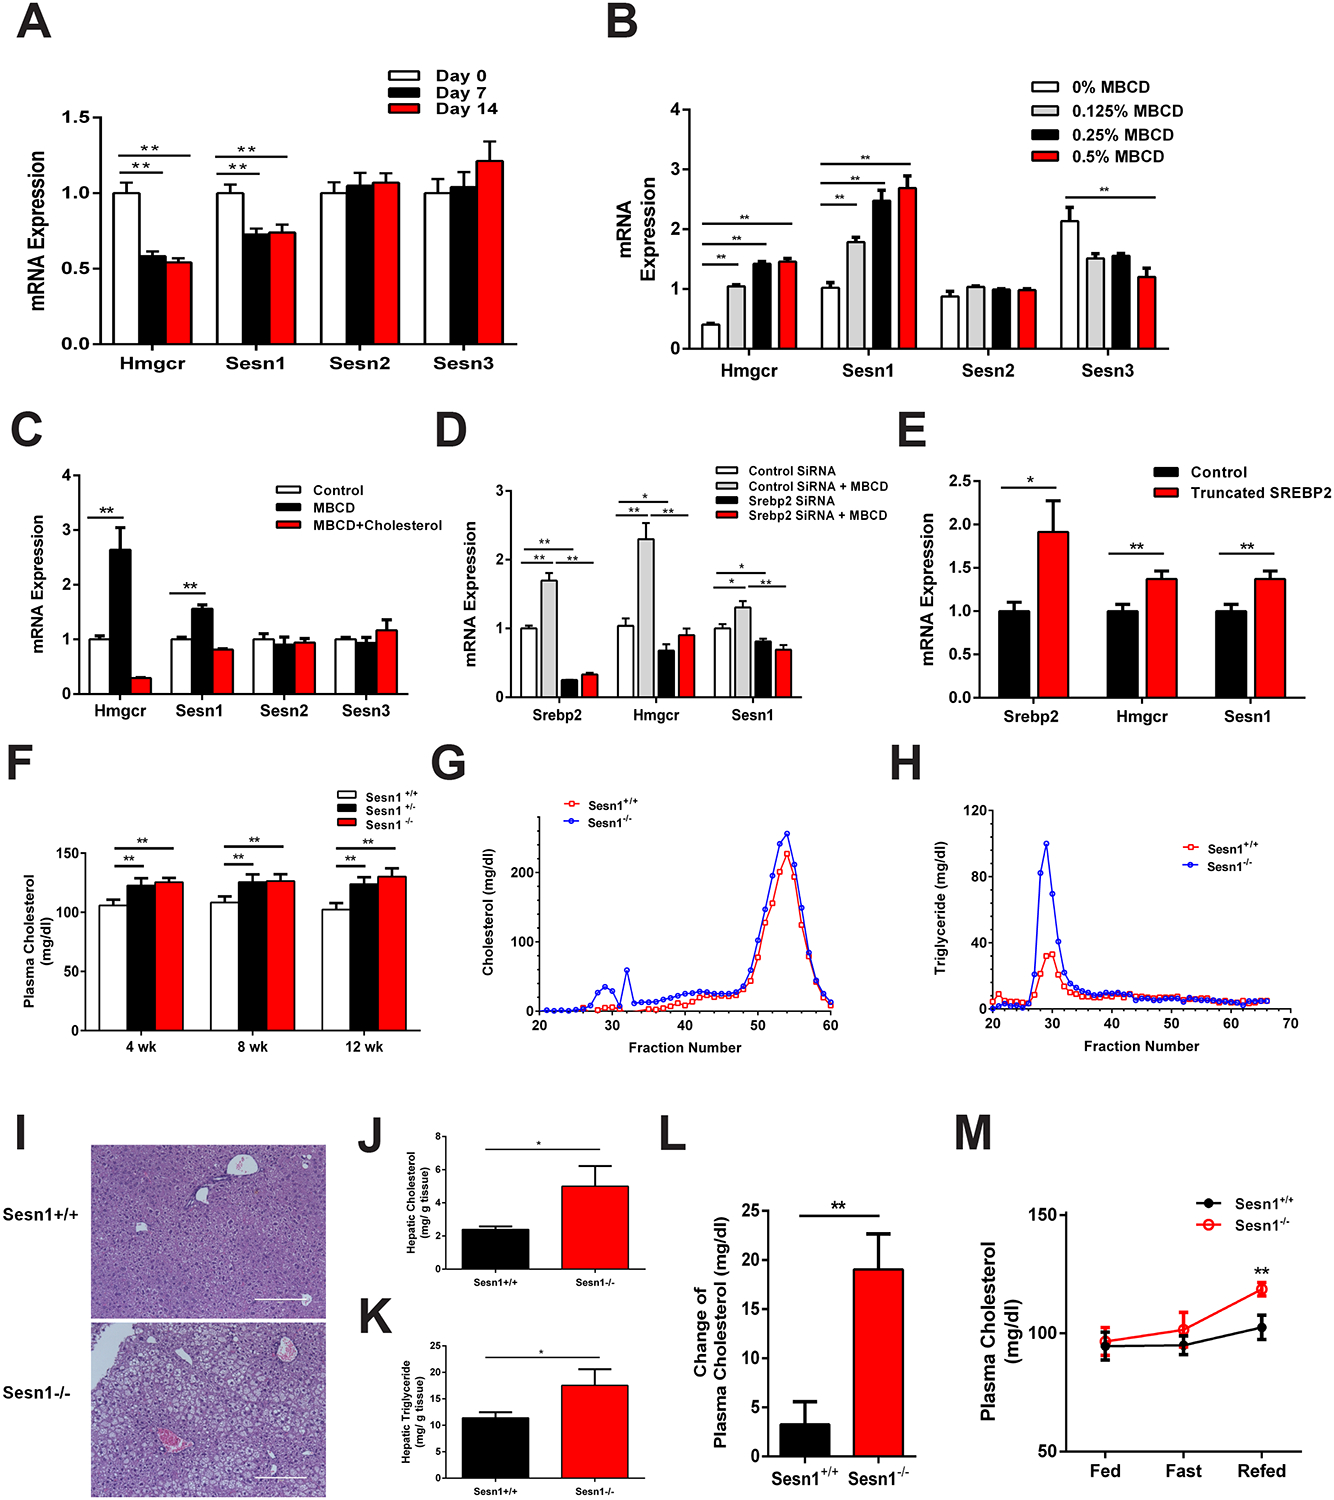
Figure 4. Sesn1 is required to maintain normal plasma cholesterol levels in mice.

(A) Liver mRNA expression level in mice fed cholesterol diet for 0 (white), 7 (black), and 14 days (red). n = 9.
(B) mRNA expression level in AML12 cells treated with 0% (white), 0.125% (gray), 0.25% (black) or 0.5% MBCD (red). n = 3.
(C) Gene expression of Sesn1 in response to cellular cholesterol. AML12 cells treated with MBCD (black) or MBCD with cholesterol complexes (red). n = 3.
(D) mRNA expression level in SREBP2 siRNA transfected AML12 cells, with or without MBCD treatment. n = 3.
(E) mRNA expression levels in control (black) or truncated Srebp2 plasmid (red) transfected AML12 cells. n = 3.
(F) Total plasma cholesterol levels in Sesn1+/+ (white), Sesn1+/− (black) or Sesn1−/− (red) mice after cholesterol diet feeding for 4, 8, and 12 weeks. n > 14.
(G-H) Fast protein liquid chromatography (FPLC) analysis of plasma cholesterol (G) and triglyceride (H) in Sesn1+/+ (red) and Sesn1−/− (blue) mice. n = 6
(I, J, K) H&E staining (I), hepatic cholesterol (J), and triglyceride content (K) in 12 weeks cholesterol diet fed Sesn1+/+ (top panel) and Sesn1−/− (bottom panel) mouse livers.
(L) Change of plasma cholesterol levels in Sesn1+/+ (black) and Sesn1−/− (red) mice after three days of cholesterol diet feeding. n > 13.
(M) Plasma total cholesterol levels in female Sesn1+/+ (black) and Sesn1−/− (red) mice under random-fed, fasted or refed. n = 5.
Data represented is mean ± SE, **P < 0.01, *P < 0.05.
