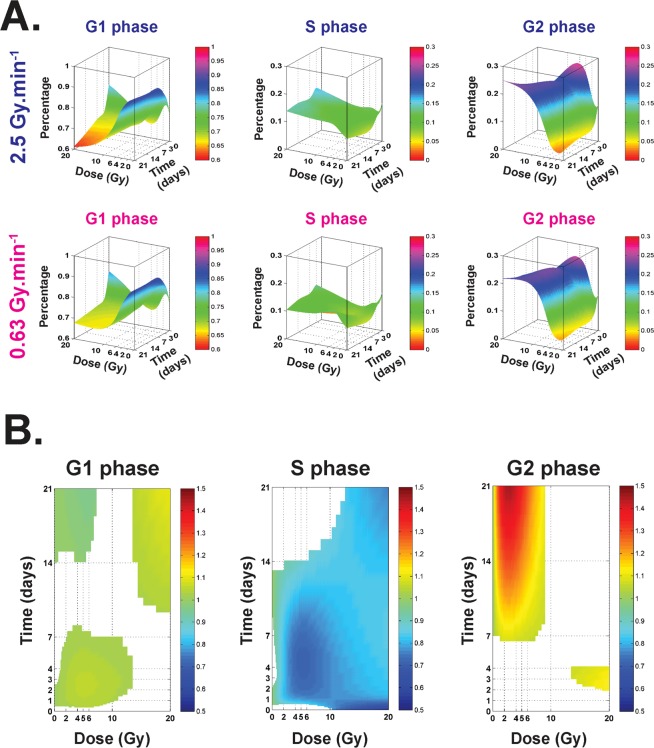
Figure 2.
Cell cycle proportions at 0.63 and 2.5 Gy.min−1. (A) Modeling of cell cycle proportions (G1, S and G2) according to the dose and time (surfaces represent the mean of at least three independent experiments). (B) Representations of 2D curves of the cell cycle ratio [0.63/2.5 Gy.min−1] for the phase (G1 (left), S (middle) and G2 (right). Colored surfaces represent statistically significant differences between the two dose rates. Colors indicate the value of the ratio.

