Figure 3.
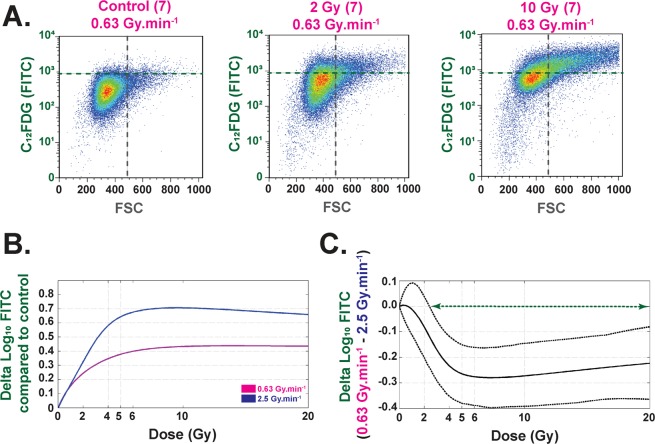
Senescence (C FDG) (Flow Cytometry) analysis. (A) Example of flow cytometry measurements obtained at D7 for control, 2 and 10 Gy irradiations at 4 MV and 0.63 Gy.min−1. Each bi-parametric representation (Size (FSC)/C FDG (FITC)) represents one independent experiment for at least 5x10 living cells. (B) Each curve (purple and blue for 0.63 and 2.5 Gy.min, respectively) represents the delta of Log FITC compared to control conditions. Each curve represents the mean of three independent experiments based on at least 5x10 living cells for each experiment. (C) The curve represents the delta log FITC (0.63-2.5 Gy.min−1) as a function of the dose. The green arrow represents the range of dose where this delta is significant between the two dose rates (from 2.2 to 20 Gy).

