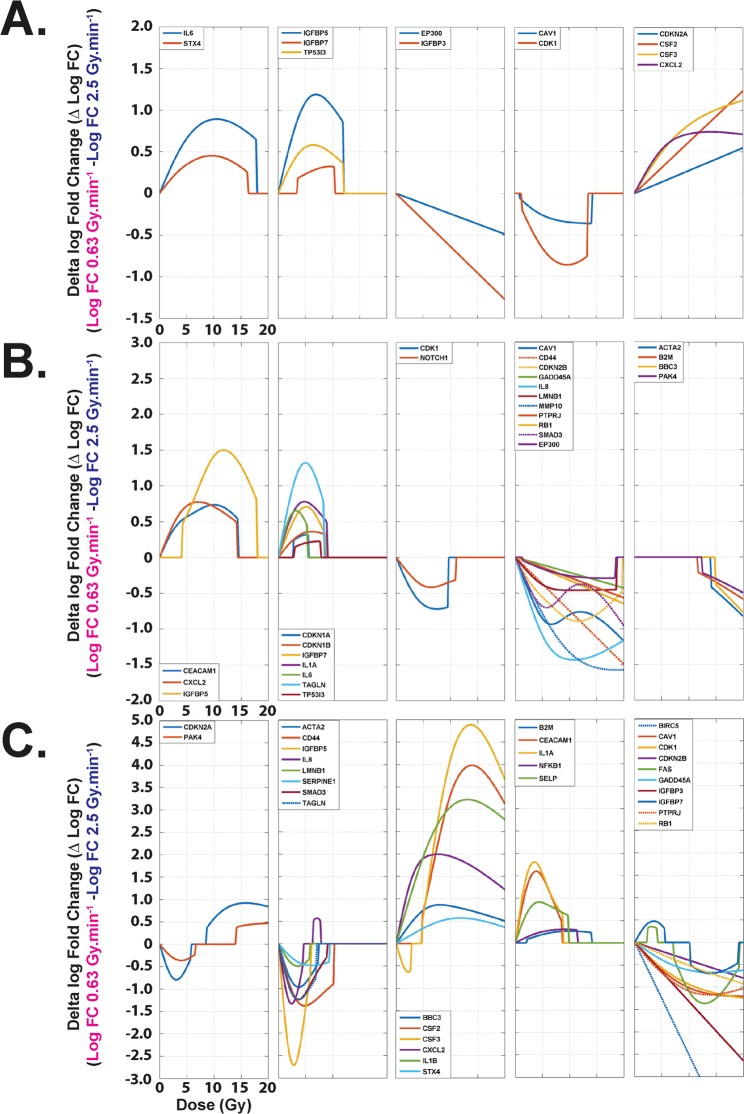
Figure 4.
RT-qPCR gene expression clustering. (A) Gene clusters at D3 post-irradiation, each curve representing the delta of fold changes for one gene (0.63 − 2.5 Gy.min−1). Genes were grouped in five clusters according to their expression tendencies as a function of the dose. Only the significantly differentially expressed genes in the delta fold change (13 among the 44 measured) are represented. (B) Gene clusters at D7 post-irradiation. Genes were grouped in five clusters according to their expression tendencies as a function of the dose. Only the significantly differentially expressed genes in the Delta fold change (27 among the 44 measured) are represented. (C) Gene clusters at D21 post-irradiation. Genes were grouped in five clusters according to their expression tendencies as a function of the dose. Only the significantly differentially expressed genes in the delta fold change (31 among the 44 measured) are represented.

