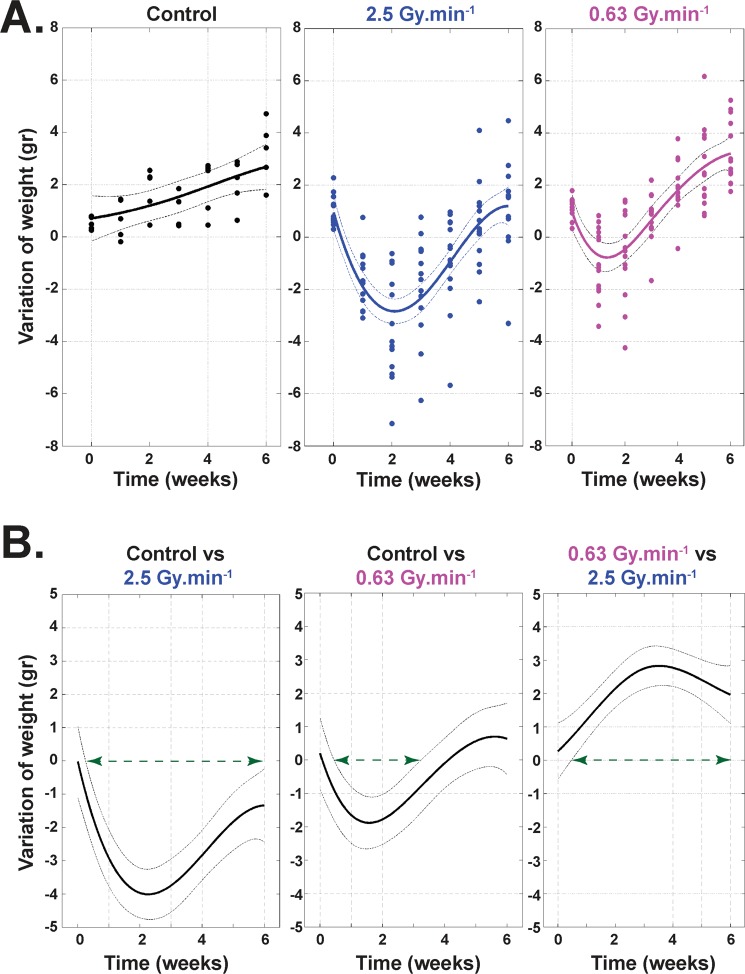
Figure 5.
Weight follow-up of animals. (A) Follow-up of the animals’ weights from 0 to 6 weeks after irradiation, with sham-irradiated controls (left panel, n =5 animals), after 19 Gy irradiation at 2.5 Gy.min−1 (middle panel, n = 12 animals), and after 19 Gy irradiation at 0.63 Gy.min−1 (right panel, n = 12 animals). (B) Statistical representation of the loss of weight, control versus 2.5 Gy.min−1 irradiation (left panel), control versus 0.63 Gy.min−1 irradiation (middle panel) and 0.63 versus 2.5 Gy.min−1 irradiation (right panel). For each panel, the green arrow represents the range of doses for which there is a statistically significant difference between the two considered conditions.

