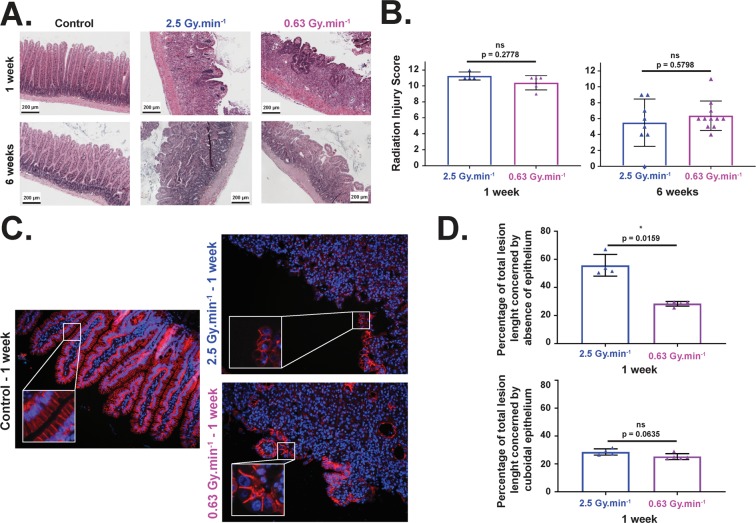
Figure 6.
Histological analysis and lesion scorings after 19 Gy localized intestinal radiation exposure. (A) Representative microscopic alterations obtained in 0.63 and 2.5 Gy.min−1 mice 1 and 6 weeks after irradiation. Slides were stained with hematoxylin-eosin-saffron. Scale bar = 200 μm. (B) A semi-quantitative radiation injury score was assigned to irradiated tissues from both beams 1 and 6 weeks after irradiation (n = 6 animals per group for 1 week end-point, n = 12 animals per group for 6 week end-point, adherences were removed from the figure). (C) Examples of p120 catenin staining performed at 1 week on small intestine section of non-irradiated mice (left panel), and mice irradiated at 2.5 Gy.min−1 (right upper panel) and 0.63 Gy.min−1 (right bottom panel) (original magnification x200). (D) Percentages of bordering epithelium with severe damage (upper panel) and cuboidal cells (bottom panel) (∗, p < 0.05).

