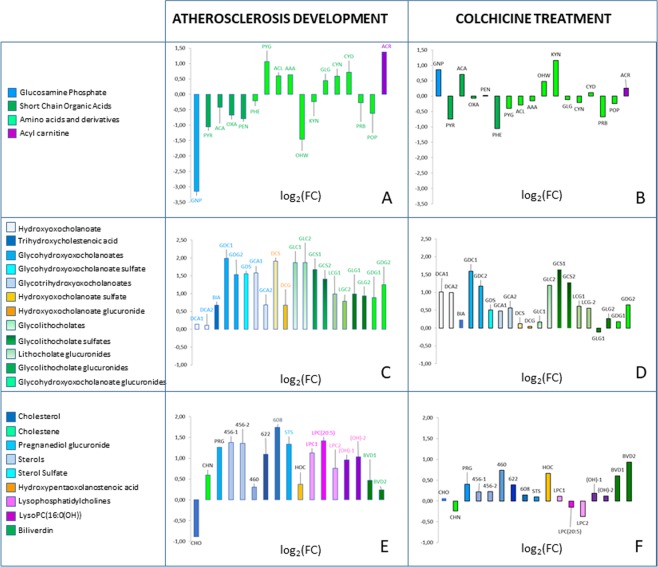
Figure 2.
Graphical summary of the variations. All metabolites that were significantly changed due to the factor Atherosclerosis, or the factor Colchicine, or both are gathered. Ordinates represent log2(FC) between the compared groups: Pannels (A,C,E), changes 36 weeks vs. 18 weeks, without colchicine (atherosclerosis progression); Pannels (B,D,F), changes 36 weeks with colchicine vs. 36 weeks without colchicine. Codes for metabolites as in Table 2.

