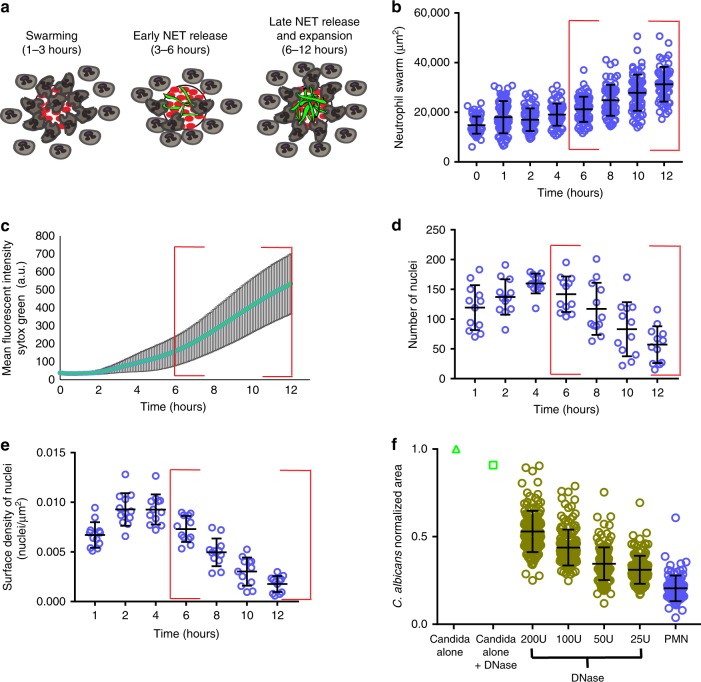
Fig. 3. Human neutrophils release NETs during swarming to C. albicans.
Human neutrophils were incubated with C. albicans arrays with Sytox green included in the solution to visualize NET formation during swarming. A cartoon model is shown in (a), demonstrating the distinct phases of swarming and NET release. The area of the neutrophil swarms around C. albicans (b), the mean fluorescent intensity of Sytox green staining in the swarm (c), the number of nuclei in the swarm (d) and the number of nuclei/µm2 (e) were all quantified. A red box highlights the timeframe of NET formation and late phase swarm expansion (b–e). N = 68 swarms across three donors for except for the 12 hour timepoint, where N = 60 swarms across three donors (b). N = 44 swarms for (c). N = 12 swarms for d and e. The inclusion of DNase in the media during the swarming assay results in a dose dependent loss of control of C. albicans growth (f). Results are normalized to the growth of the C. albicans alone control. N = 144 swarms over 3 independent donors except for the control PMN group where N = 95 swarms over 3 donors. Error bars represent mean +/− standard deviation.

