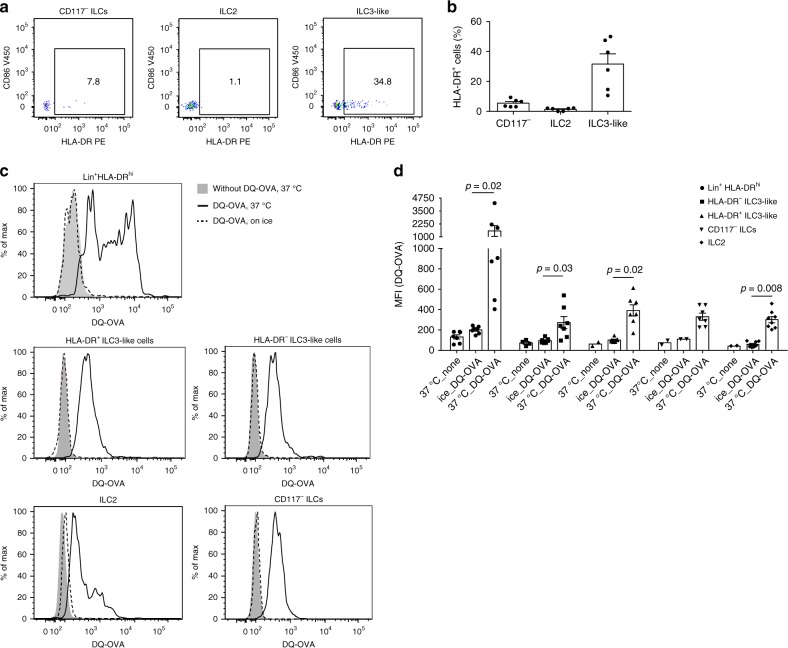
Fig. 2. HLA-DR and co-stimulatory molecule expression on and DQ-OVA uptake by PB ILC subsets.
a Representative flow cytometric dot plots of HLA-DR and CD86 expression on PB CD117−ILCs, ILC2 and ILC3-like cells, defined as Lin−CD127+CD161+CRTH2−CD117−, Lin−CD127+CD161+CRTH2+ and Lin−CD127+CD161+CRTH2−CD117+ cells, respectively. b Mean of HLA-DR expression on PB ILC subsets. N (donors) = 6; bars indicate mean value; error bars indicate SEM. c Representative histograms and d summarized data of fluorescence emission by sort-purified PB CD117− ILCs, ILC2, HLA-DR+ ILC3-like cells, HLA-DR− ILC3-like cells and Lin+HLA-DRhi cells after 4 h incubation with 10 μg/ml DQ-OVA. c Gray filled histograms depict cells incubated without DQ-OVA, solid black lines show cells incubated with DQ-OVA at 37 °C, and dashed black lines—cells incubated with DQ-OVA on ice. d N (donors) = 7. Due to limited cell numbers, we could not generate data for all conditions for every donor. Bars and error bars indicate mean and SEM; statistical significance was assessed using two-sided Wilcoxon matched-pairs signed rank test. Source data are provided as a source data file.

