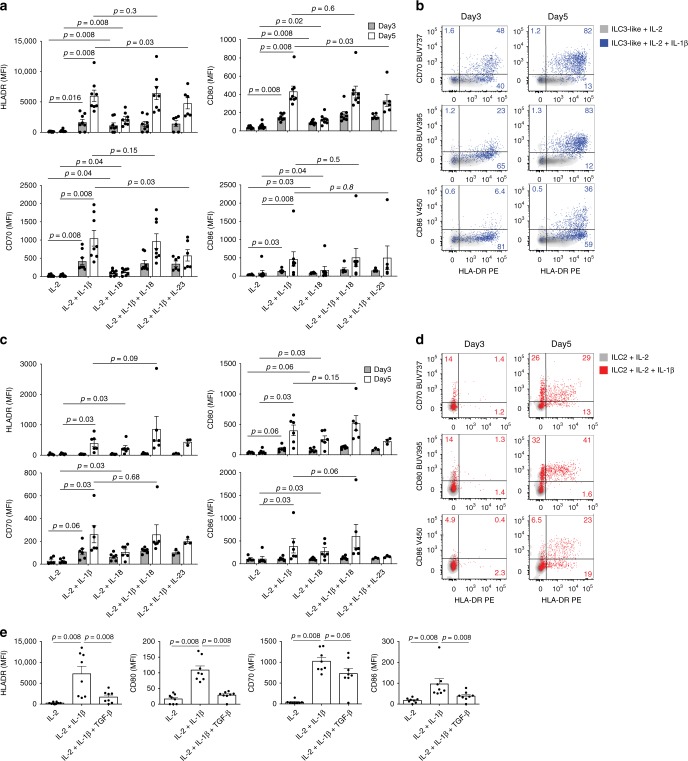
Fig. 4. HLA-DR and co-stimulatory molecule expression on PB ILCs in response to cytokine treatment.
a, c Summarized data and b, d representative flow cytometric dot plots of HLA-DR, CD86, CD80, and CD70 expression by sort-purified ILC3-like cells (a, b) and ILC2 (c, d) after 3 and 5 days of treatment with the indicated cytokine combinations. N (donors) = 8 (for ILC3-like cells) and 6 (for ILC2). Due to limited cell numbers, we could not generate data for all conditions for every donor; source data are provided as a source data file. e HLA-DR, CD86, CD80, and CD70 expression by sort-purified ILC3-like cells after 5 days of IL-2, IL-2 plus IL-1β, or IL-2 plus IL-1β, and TGF-β treatment. N (donors) = 8; bars and error bars indicate mean and SEM; statistical significance was assessed using two-sided Wilcoxon matched-pairs signed rank test. Source data are provided as a source data file.

