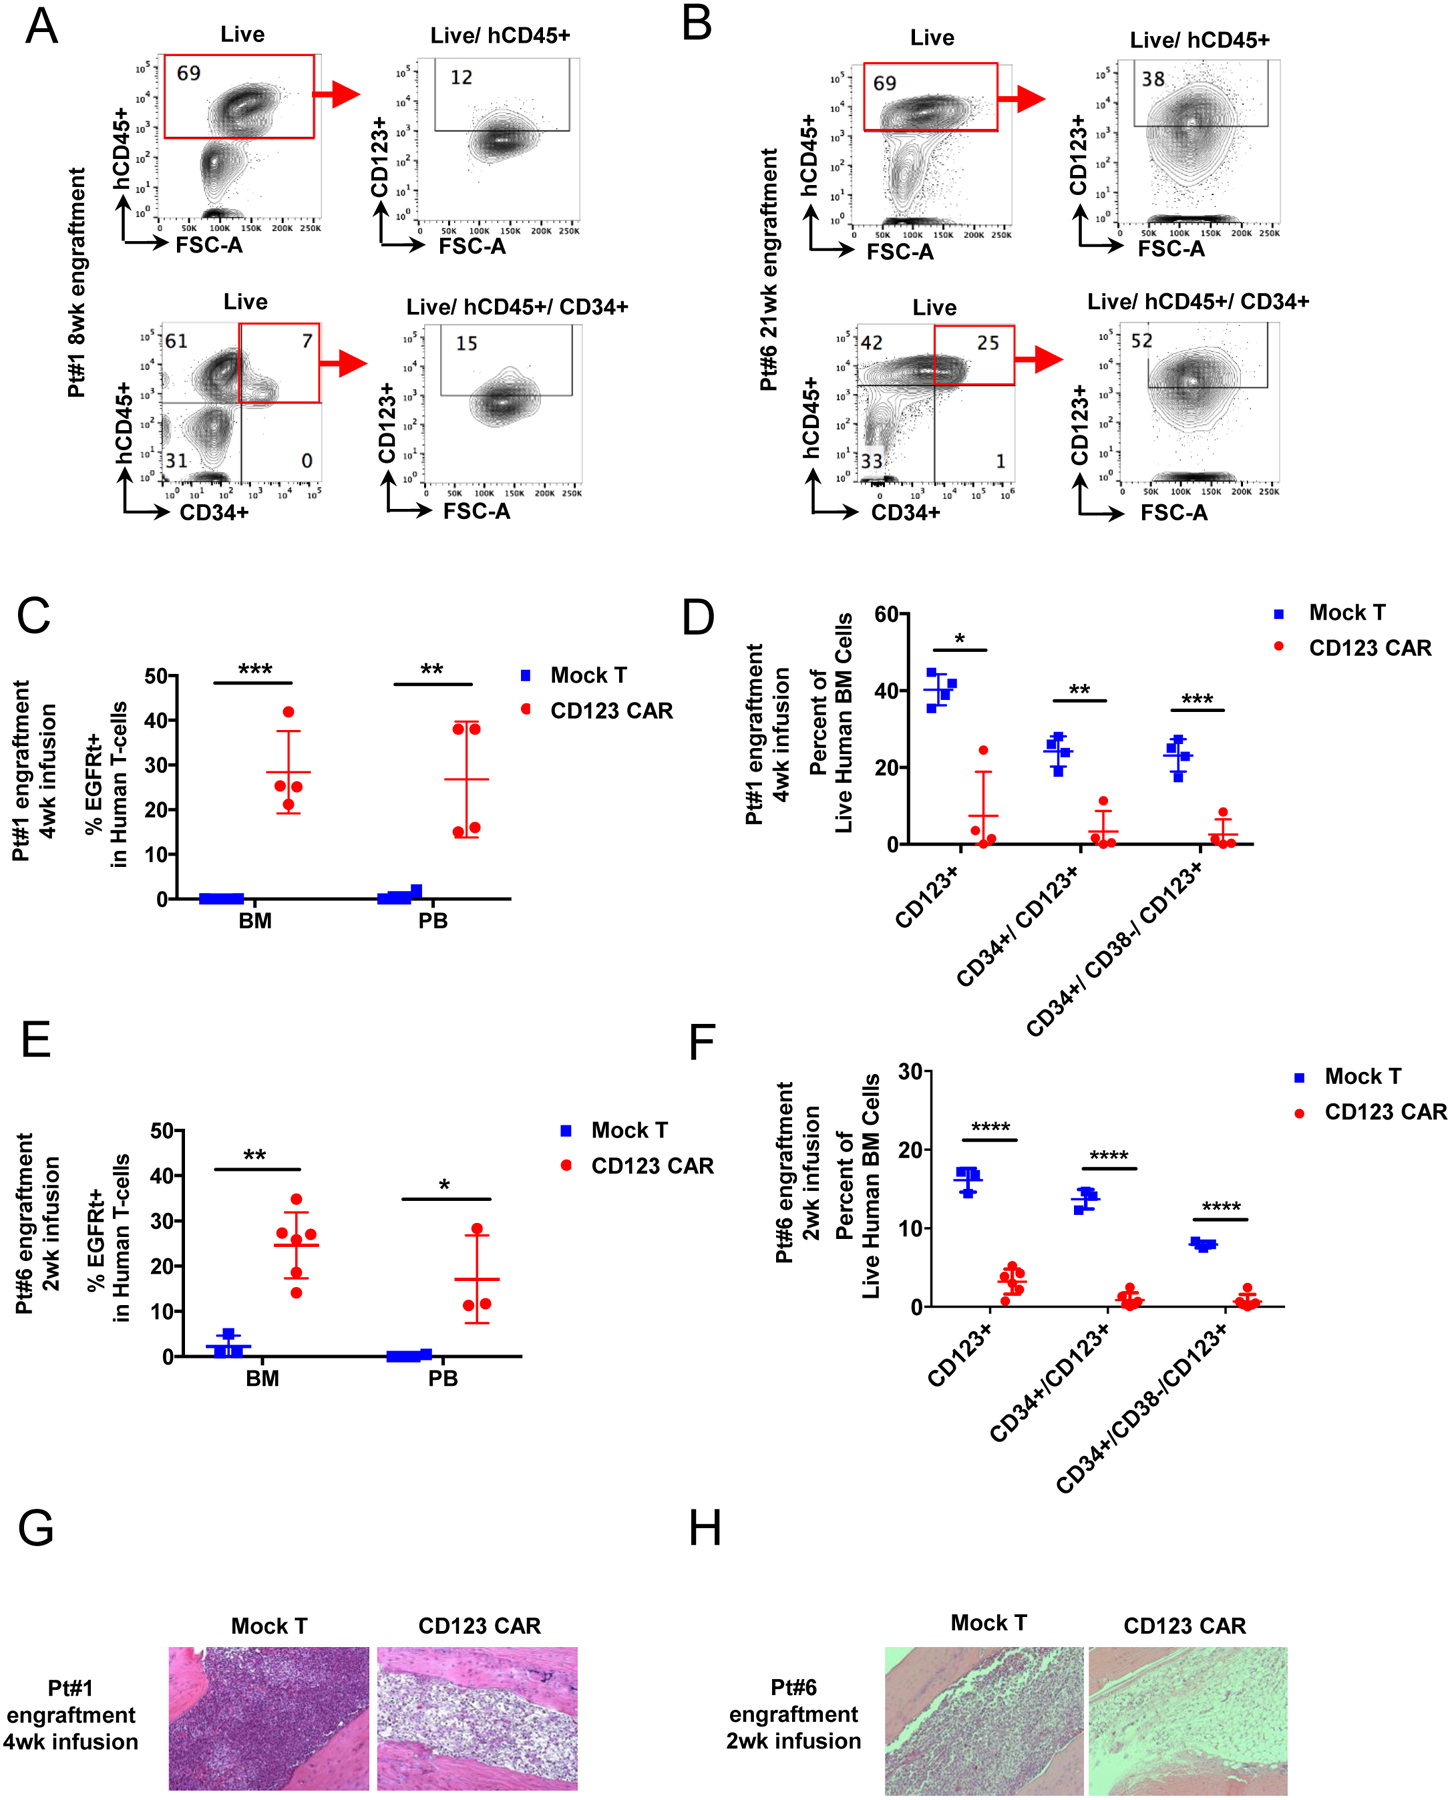
Figure 4. Eradication of MDS tumor cells in patient derived xenograft by autologous CD123 CAR T cells.

(A-B) Primary MDS cells from 2 high-risk MDS patients (pt#1, #6) were used to generate PDX mice. Representative flow cytometry analysis of each patient sample for CD123+ population in both hCD45+ and hCD45+/CD34+ populations after 8 or 22 weeks of engraftment is shown in pt#1(A) and pt#6 (B). Red boxes denote engrafted human cells (hCD45+). (C-D) PDX from pt#1 were treated with autologous CD123 CAR T cells (red) or mock T cells (blue). 4 weeks later mice were analyzed for persistence of CD123 CAR T cells in bone marrow and peripheral blood (C) and elimination of MDS stem cells (D). (E-F) PDX from pt#6 were treated with autologous CD123 CAR T cells (red) or mock T cells (blue). 2 weeks later mice were analyzed for persistence of CD123 CAR T cells in bone marrow and peripheral blood (E) and elimination of MDS stem cells (F). (mean ± SD, unpaired parametric t-test, n=4 for each group of mock or CD123 CAR T cells for pt#1 xenografts, n = 3 for group of mock and n = 5 for group of CD123 CAR T cells for pt#6 xenografts. (G-H) Representative morphology of MDS xenograft bone marrow showing MDS tumor eradication at 2 or 4 weeks post CD123 CAR T cell infusion in MDS PDX mice pt#1 (G) and pt#6 (H). (Mean ± SD, unpaired parametric t-test. * p ≤ 0.05, ** p ≤ 0.01, *** p ≤ 0.001, **** p ≤ 0.0001)
