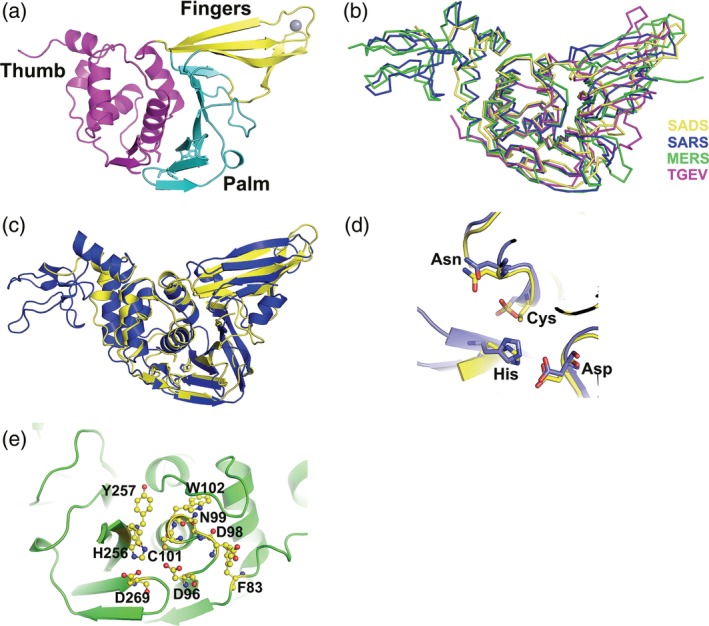
FIGURE 2.

Overall structure of SADS‐CoV PLP2, the comparisons with SARS‐CoV and MERS‐CoV PLPros and TGEV PLP1 and the proposed active site of SADS‐CoV PLP2. (a) The overall structure of SADS‐CoV PLP2, locations of the thumb (magenta), palm (cyan), and fingers (yellow) domains are indicated by different colors. The zinc atom (red) is shown in gray sphere representation. (b) Comparison of the structure of SADS‐CoV PLP2 with those of SARS‐CoV PLPro (PDB ID: https://bioinformatics.org/firstglance/fgij//fg.htm?mol=4OVZ), MERS‐CoV PLpro (PDB ID: https://bioinformatics.org/firstglance/fgij//fg.htm?mol=4P16) and TGEV PLP1 (PDB ID: https://bioinformatics.org/firstglance/fgij//fg.htm?mol=3MP2). A ribbon diagram shows SADS‐CoV PLP2 in yellow, SARS‐CoV PLpro in blue, MERS‐PLpro in green, and TGEV PLP1 in magenta. (c) Superimposition of the structures of SADS‐CoV PLP2 (yellow schematic) over SARS‐CoV PLPro (blue schematic) shown in cartoon. Catalytic triad residues are shown in ball‐and‐stick representations. The orientation of structures shown in (b) and (c) are similar to that of (a). (d) Close‐up view of the active site segments for SADS‐CoV PLP2 (carbon atoms in yellow) and SARS‐CoV PLpro (carbon atoms in blue). The Cys‐His‐Asp triad and the asparagine as the oxyanion hole residue are conserved in the three‐dimensional structures. (e) Proposed SADS‐CoV PLP2 active site. Catalytic residues, C101, H256 and D269, and other important active‐site residues such as F83, D96, D98, N99, W102, and Y257 are shown in ball‐and‐stick
