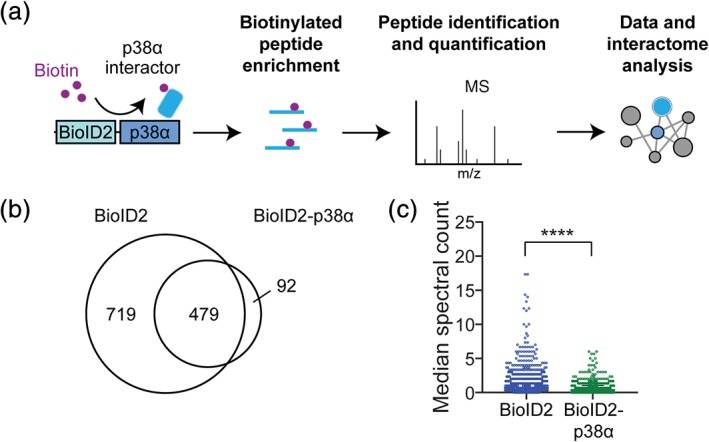
Figure 2.

Quantification and evaluation of proteins biotinylated by BioID2 and BioID2‐p38α. (a) Experimental schematic of intracellular proximity‐dependent ligation with fusion protein BioID2‐p38α. Samples enriched for biotinylated peptides were analyzed by liquid chromatography–tandem mass spectrometry (LC–MS/MS). Nonredundant proteins were subjected to STRING network analysis for known protein–protein interactions and to DAVID gene ontology (GO) analysis. (b) Venn diagram of unique biotinylated proteins identified in the control BioID2 and/or BioID2‐p38α samples. (c) Quantification and comparison of median spectral count (SC) per biotinylated protein for samples from BioID2‐p38α‐ and BioID2‐expressing cells. Data are represented as median ± confidence interval of three independent experiments (n = 3) ****p < .0001 (Wilcoxon paired test)
