
Figure 4.
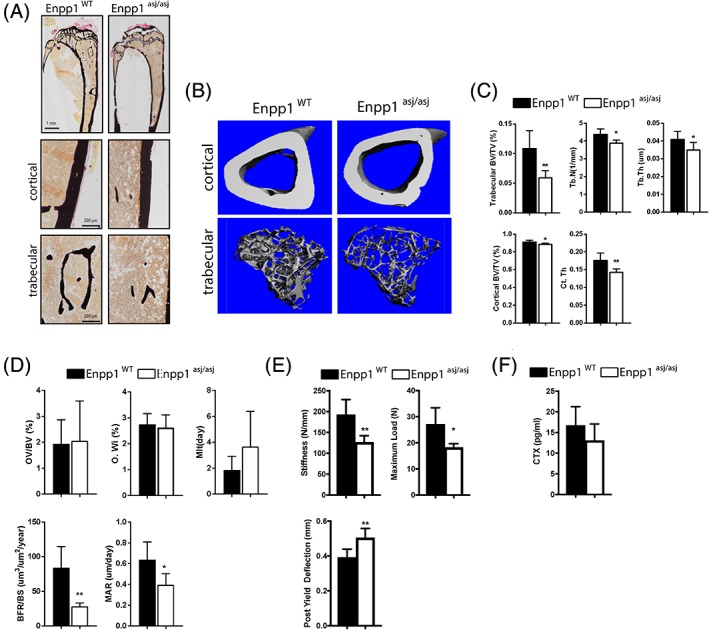
Bone histology of WT and Enpp1 asj/asj mice at 23 weeks. (A) Von Kossa staining of tibia (top) and cortical and trabecular bone (bottom) of 23 ‐week WT and Enpp1 asj/asj male mice. (B) Reconstructed images from micro‐CT scans of tibial trabecular and cortical bone. (C) Micro‐CT quantification of trabecular BV/TV, trabecular thickness (Tb. Th), and trabecular number (Tb.N) and cortical BV/TV and cortical thickness (Ct.Th) (D). Histomorphometric quantification of osteoid volume (OV/BV), osteoid width (O.Wi), mineralization lag time (MLT), bone formation rate (BFR/BS), mineral apposition rate (MAR). (E) Biomechanical quantification by four‐point bending of femur bone parameters (stiffness, maximum load, and post yield deflection). (F) Concentration of C‐telopeptide of type 1 collage (CTX) in plasma of 23‐week WT and Enpp1 asj/asj mice. n ≥ 4 (C–E). Data are the means ± SEM. *p < 0.05; **p < 0.01 (Student's unpaired t test).