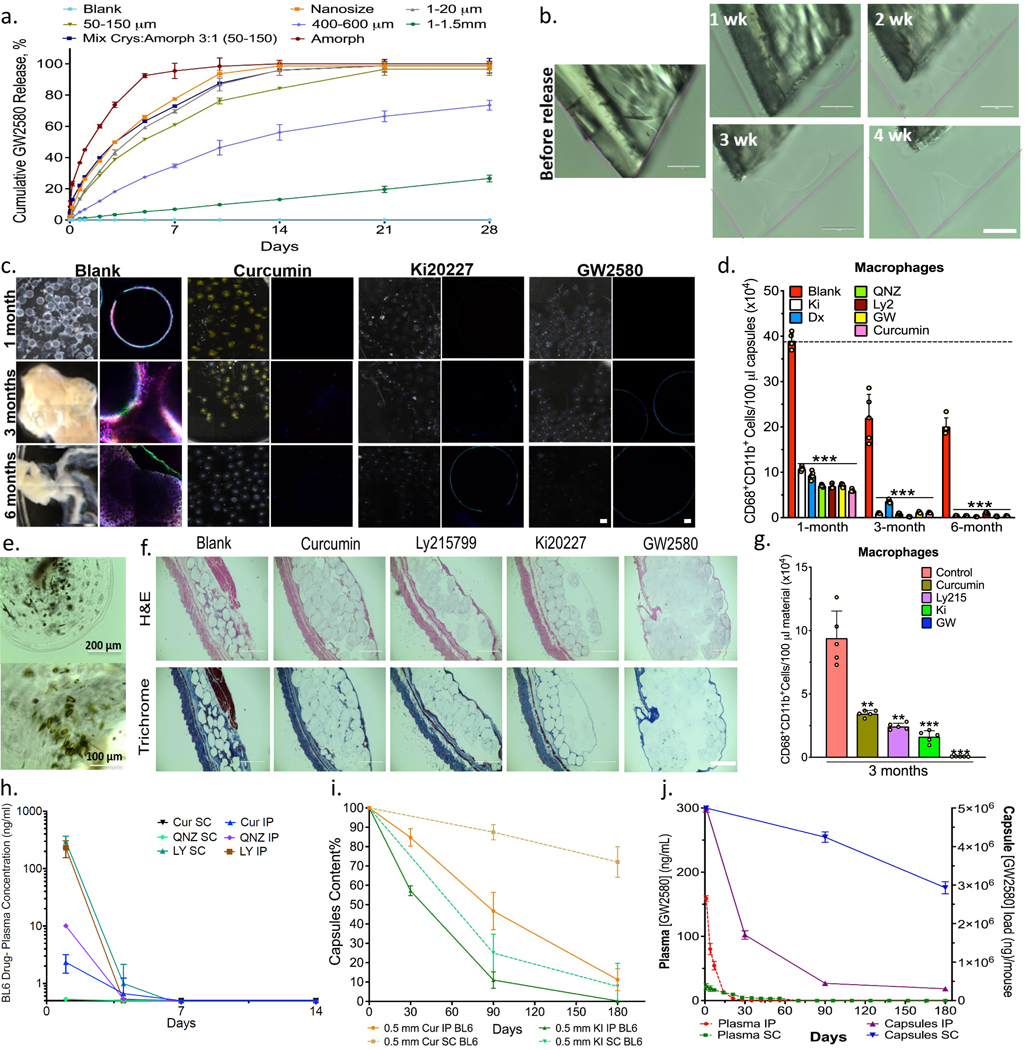
Figure 3. In vitro release and in vivo anti-fibrotic efficacy.
Agents tested in alginate spheres both in vitro and in C57BL/6 mice. a) In vitro GW2580 (GW) release under accelerated conditions (37ºC, PBS+0.1% SDS) encapsulated within 2000μm alginate capsules. Release from crystalline formulations tuned by varying crystal size and amorphous-to-crystalline ratio (as specified), Mean+/−SD. b) Surface erosion of GW2580 large crystal over 1-to-4 weeks; original dimensions shown with pink lines. Scale bar=100μm. c) Phase contrast and confocal images for retrieved capsules after 1, 3, and 6-month IP implantations. Phase contrast images showing host FBR, observed as yellowish-white plaque on otherwise translucent alginate microspheres. Crystalline formulations encapsulated in 500μm alginate spheres showed significant long-term anti-fibrotic efficacy. Note:drug crystals have a colored appearance, making capsules more opaque (See Supplementary Fig. 10c). Confocal images showing reduced or no fibrotic overgrowth with drug crystals (Blue, DAPI nuclear stain; Green:Macrophage CD68; and Red:Fibrosis marker αSMactin). Scale bars, phase contrast:500μm; confocal image:50μm. d) FACS analysis performed on cells dissociated from retrieved spheres after 1, 3, and 6 months post-IP implantation. e) Images of retrieved capsules containing crystalline curcumin after 6 months post-IP implantation. f) H&E and Masson’s Trichrome stained histologic sections of 3-month subcutaneous (SC) implants (+tissue) showing reduced fibrosis with crystalline drugs, vs. blank controls (Scale bar=1000μm; 4X). g) Flow analysis for macrophages dissociated from spheres, (100μl material in all cases) 3 months following SC implantation. h) Plasma drug concentrations from separate crystalline-drug formulations SC or IP implantations (Cur:curcumin; LY:Ly2157299; and QNZ). Though shown to 14 days, all drugs were monitored and remained below detection limits up to 180 days. i) HPLC-determined capsule drug content after 1, 3, and 6-months (SC&IP) for crystalline curcumin and Ki20227. j) LCMS determination of GW2580 levels in plasma (Left-y-axis) vs. in capsules (Right-y-axis) following SC or IP implantation. In vitro, N=3 samples/group. All line and bar graph data:mean±SEM. Statistical analysis:one-way ANOVA plus Bonferroni multiple comparison correction; **:p<0.001, and ***:p<0.0001. In vivo studies, N=5 mice/group. All subpanels reflect representative data from in vitro or in vivo experimental analyses repeated 3-times in each case.

