
Figure 1. NONU-1 and Its Homologs Have a Conserved Function in Nonstop Decay.
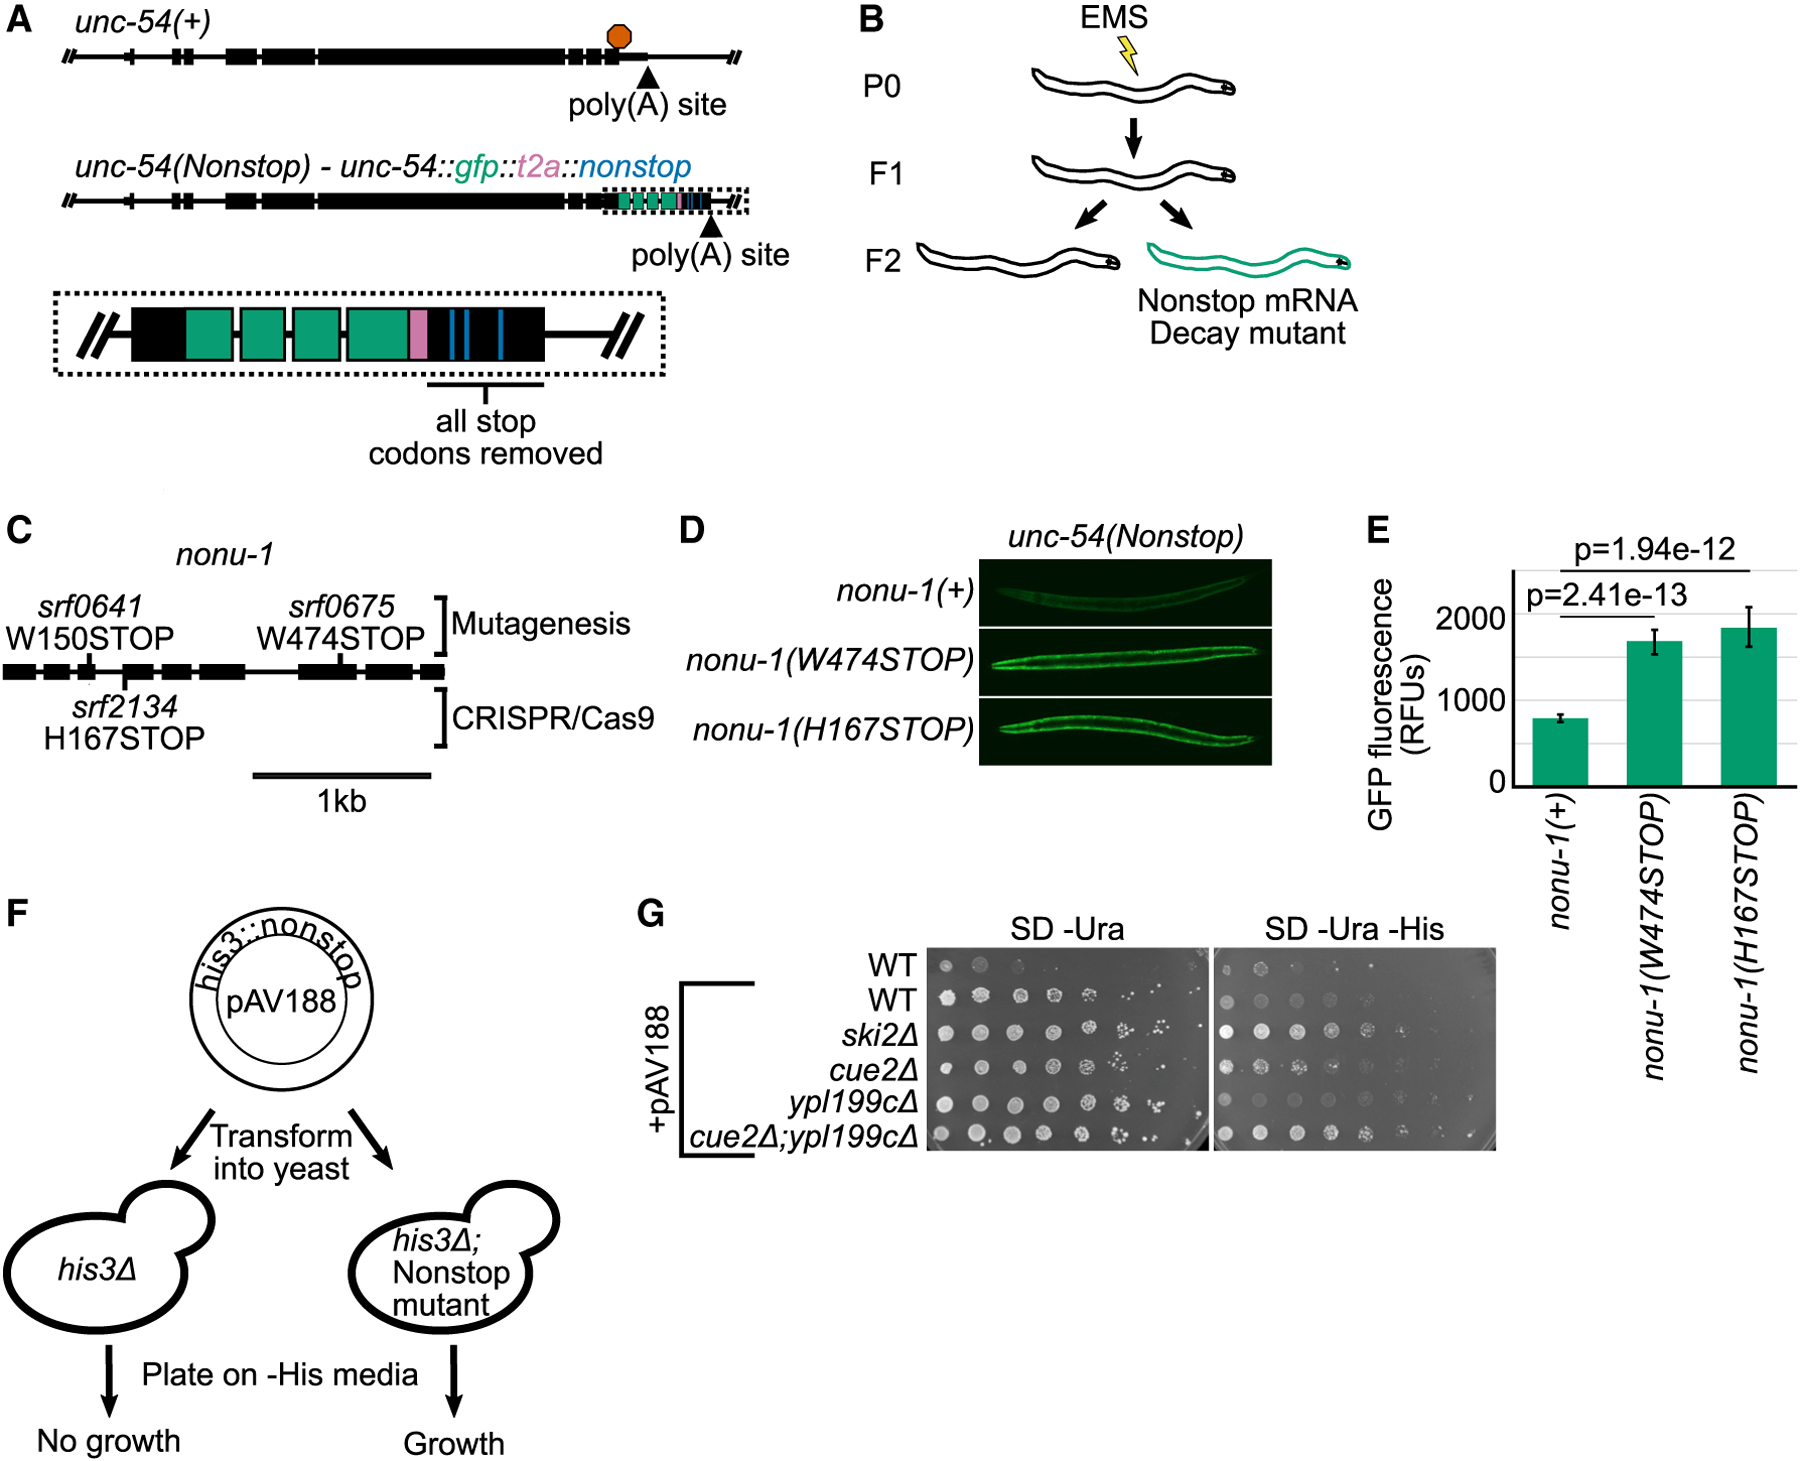
(A) Gene diagrams showing annotated exons (black rectangles) at the wild-type unc-54 locus (top) and the unc-54(nonstop) reporter (bottom). Red octagon indicates the stop codon; triangles indicate poly(A) sites. Inset shows zoom in with GFP (green), T2A (pink), and re-coded stop codons (blue).
(B) Cartoon of the genetic screen to identify nonstop mRNA decay mutants.
(C) Gene diagram showing annotation of the nonu-1 locus. Mutations made via EMS and CRISPR/Cas9 are above and below the gene, respectively.
(D) Images of GFP expression in the indicated strains. See STAR Methods.
(E) Quantification of GFP expression for strains shown in (D). Each bar represents average images of at least five different animals; 95% confidence interval shown as error bars. p values from Student’s t test comparing mutants with nonu-1(+). RFUs, relative fluorescence units.
(F) Diagram of the S. cerevisiae nonstop decay assay. See text for details.
(G) The indicated strains were transformed with the reporter plasmid, and strains were serially diluted and plated on the indicated media. Pictures are representative of experimental triplicates.