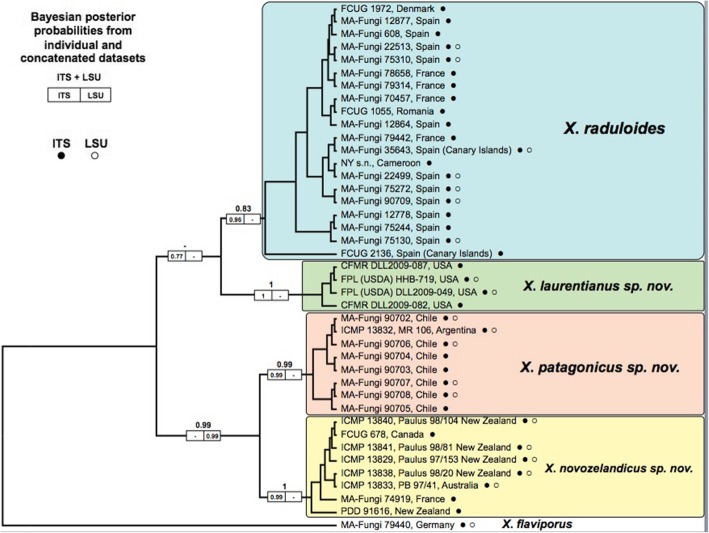
Fig. 2.
Topology of ITS + LSU tree obtained by Bayesian inference using BEAST. Bayesian posterior probabilities for the combined ITS and LSU dataset are indicated in the larger number above the boxes. Individual gene posterior probabilities for ITS and LSU regions are indicated in the left and right boxes on a branch, respectively. Filled and empty circles indicate whether ITS or LSU sequence of a sample was used in the analysis

