Figure 4.
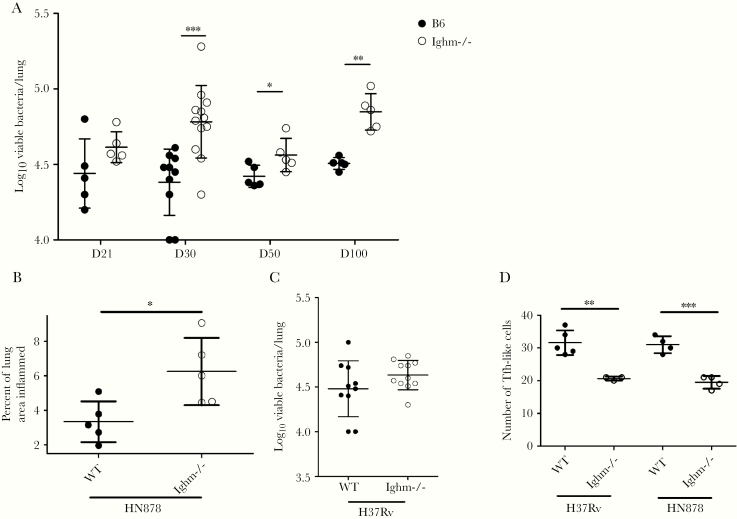
B-cell deficient mice show increased susceptibility to HN878 infection. C57BL/6 (B6) and Ighm−/− mice were aerosol infected with ~100 colony-forming units (CFUs) of Mycobacterium tuberculosis (Mtb) H37RV or Mtb HN878. (A) Bacterial burden in the lung of B6 and Ighm−/− HN-infected animals was determined at different days postinfection (dpi) after plating and counting CFUs and used as a measure of susceptibility to HN infection between B6 and Ighm−/− mice. (B) The percentage of inflamed lung area was determined histologically in formalin-fixed and paraffin-embedded lung sections. Area occupied inflammation was quantified using the Nanozoomer software. Percentage from lung area occupied by inflammation per mouse lung was determined. (C) Bacterial burden in the lung of B6 and Ighm−/− Rv-infected animals was determined at 50 dpi after plating and counting CFUs and used as a measure of susceptibility to Rv infection between B6 and Ighm−/− mice. (D) At 50 dpi, the number of T cells around granulomas in B6 and Ighm−/− mice infected with Rv or HN was quantified in a ×200 field of view using the morphometric tool of the Zeiss Axioplan microscope after staining using antibodies to CD3 and CXCR5. (A–D) The data shown represent mean (±standard deviation) values from 1 to 3 independent experiments per time point (n = 4–5 mice per group in each experiment). Student t test was used to determine differences per time point. *, P < .05; **, P < .005; ***, P < .0005.

