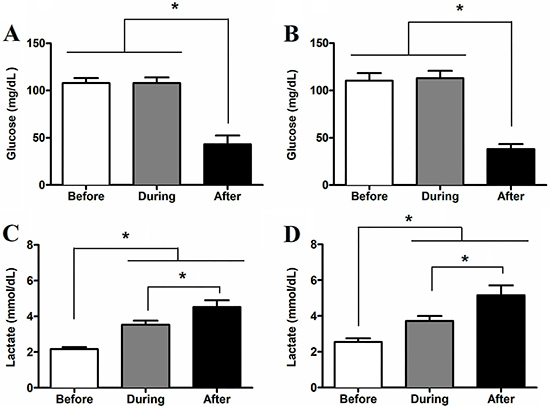
Figure 1. Serum glucose (A and B) and lactate (C and D) concentration measured before, during (50 min), and after the exhaustive test. Data for ET groups (trained animals subjected to an exhaustive test without supplementation) are shown in graphs A and C. Data for ET-AG groups (trained animals subjected to exhaustive test and supplemented with alanyl-glutamine) are shown in graphs B and D. The data (n=8) are reported as means±SD. *P<0.05, ANOVA followed by Bonferroni post hoc test.

